- Climate change is a continuous process
- Temperature is a dynamic process
- The rocks are the record
- The Earth is a dynamic system
- “The Atmospheric Greenhouse Effect”
- Climate drivers
- First-order climate controls
- Second-order climate controls
- Third-order climate controls
- Fourth-order climate controls
- The Sun and Climate on Earth
- Albedo
- Irradiance—incident solar energy—varies
- Solar Magnetic Activities
- Sunspots
- Sunspots and Wolf numbers
- Solar activity proxies
- Dendroclimatology
- Milankovitch Cycles and Glaciation
- The 100,000 year Milankovitch cycle:eccentricity
- The 41,000 year Milankovitch cycle: axial tilt
- The 23,000 year Milankovitch cycle: precession
- The Energy Budget of the Earth
- The Winds
- The Coriolis force
- The Coriolis effect and ocean currents
- The Sargasso Sea
- Geostrophic balance
- The thermohaline circulation
- Temperature-density effects
- The carbon cycle
- Estimating ancient temperatures
- Reconstructing paleoclimate
- O2 Isotopes as paleoclimate proxies
- Oxygen isotopes, temperature, and weather
- Temperature and isotope ratios
- Paleoclimate from benthic organisms
- Paleoclimate from insects
- Paleoclimate from stomatal index records
- Sea level changes
- Ocean basin changes
- Eustatic sea level changes
- The origins of the CO2 controversy
Climate change is a continuous process.
Climate change has been continuous over geological time, for more than 4 billion years, since the development of Earth’s early atmosphere and the presence of liquid water. Climate will continue to change as the Earth system responds to variations in solar radiation, geological processes, and interactions among the atmosphere, oceans, land, and biosphere.
Geological interpretations are four-dimensional. Geology considers time as well as space.
On the 10,000-year interglacial scale, the Greenland ice-core record shows a general cooling trend from the warmer conditions of the early Holocene, interrupted by shorter periods of warming. However, on the 16,000-year scale, beginning during the late Pleistocene glacial period, the transition to the present interglacial represents a substantial increase in global temperature.
Similarly, global temperature reconstructions covering approximately the last 2,000 years show substantial climatic fluctuations, including periods of warming and cooling. The reconstructions indicate a general cooling tendency during much of the preindustrial period, followed by pronounced warming during the modern era. The magnitude and direction of temperature change depend on the period examined and the methods used to reconstruct past temperatures.
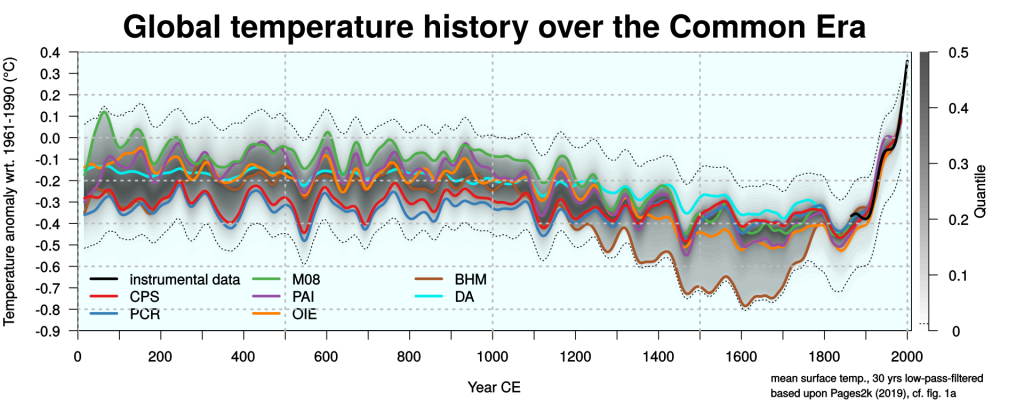
Global temperature reconstructions over the last 2,000 years, including modern instrumental observations. Source: PAGES 2k Consortium (2019), Nature Geoscience.
Temperature is a dynamic process!
Global temperatures vary over timescales ranging from years to millions of years. Some variations reflect recurring astronomical and geophysical processes, while others result from irregular events and interactions within the Earth system.
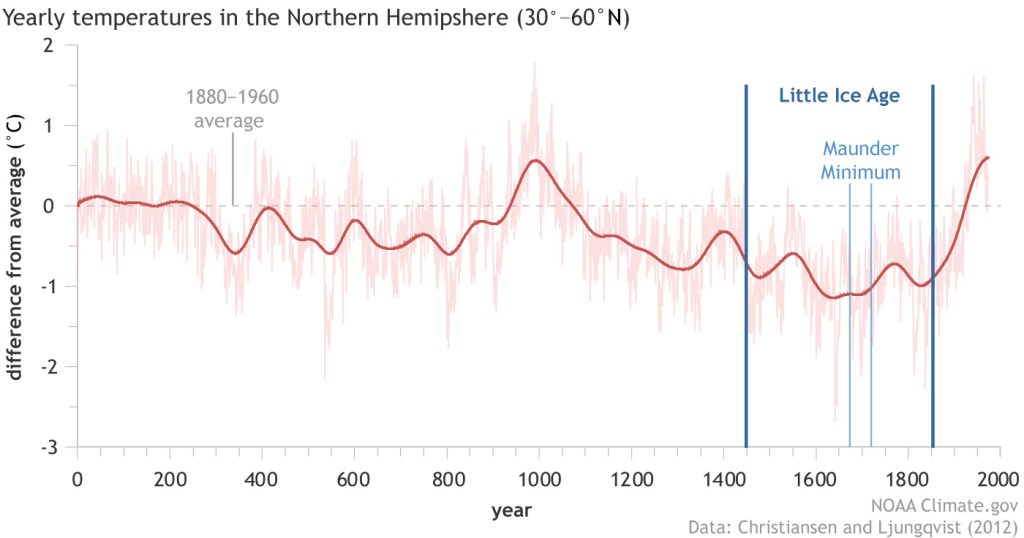
Reconstructed temperature variations in the Northern Hemisphere between 30° and 60° N over approximately 2,000 years, relative to the 1880–1960 average. The reconstruction illustrates the Medieval Climate Anomaly, the Little Ice Age, and modern warming. Source: NOAA Climate.gov, based on Christiansen and Ljungqvist (2012).
The Northern Hemisphere temperature reconstruction illustrates substantial climatic fluctuations over the last 2,000 years. Relatively warm conditions occurred around 950–1000 CE, followed by generally cooler conditions during subsequent centuries. The reconstruction also shows pronounced warming during the modern period.
During the Medieval Climate Anomaly, approximately 950–1250 CE, relatively warm conditions occurred in parts of the Northern Hemisphere, particularly around the North Atlantic. This period coincided with Norse settlement in Greenland and agricultural activity in regions where climatic conditions permitted cultivation.
The subsequent Little Ice Age, generally associated with cooler conditions between approximately 1300 and 1850 CE, affected many regions, particularly those surrounding the North Atlantic. The timing, duration, and magnitude of cooling varied geographically.
Changes in temperature, sea ice, precipitation, and growing seasons influenced agriculture, settlement, and economic activity. The historical consequences depended on regional environmental conditions and the capacity of human societies to adapt.
The reconstruction represents the Northern Hemisphere between 30° and 60° N rather than the entire globe. Regional temperature reconstructions cannot automatically be interpreted as global temperature records. These historical episodes illustrate the importance of geographical extent and timescale when interpreting climate variations.
The rocks are the record
Geology provides the historical context for understanding climate change on Earth. Sedimentary rocks, fossils, and geochemical evidence preserve information about changes in sea level, atmospheric composition, and temperature over geological time.
The Earth’s climate has varied substantially over hundreds of millions of years. Geological evidence documents intervals of extensive continental glaciation as well as prolonged periods of much warmer greenhouse conditions.
These changes occurred under different configurations of the continents and oceans, changing atmospheric conditions, and variations in geological processes that influence the Earth’s climate system.
We are presently living in the Holocene interglacial period, which began approximately 11,700 years ago. The Holocene is the current interglacial interval within the Quaternary Ice Age.
To place contemporary climate conditions in their geological context, consider the reconstructed history of global temperatures over the past 485 million years.
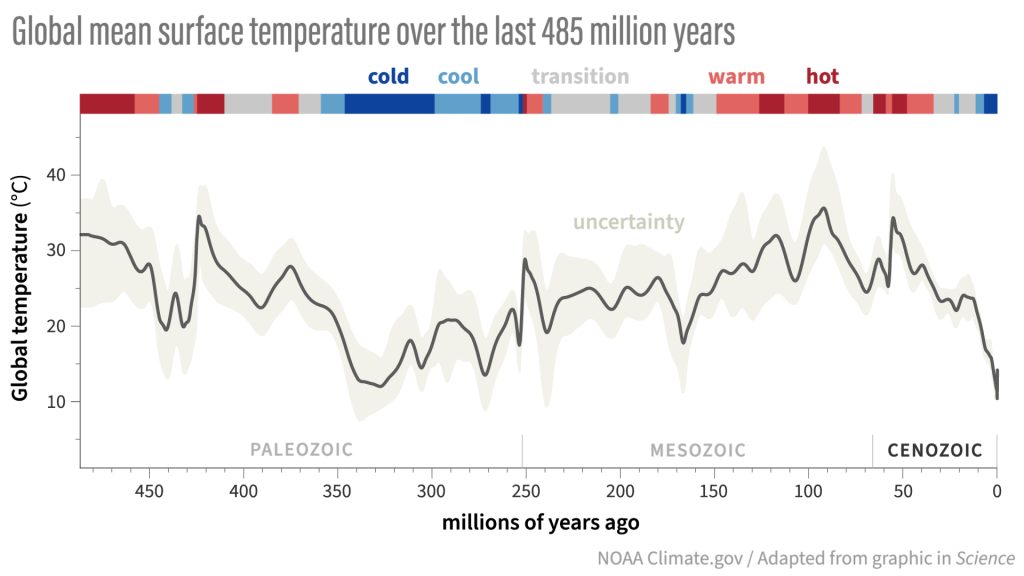
Reconstructed global mean surface temperatures over the past 485 million years. The reconstruction combines geological evidence with climate-model simulations and indicates uncertainty in estimated temperatures. Source: Judd and colleagues (2024), Science. Illustration: NOAA Climate.gov.
Moving to greater detail, consider the last 420 thousand years.
The Vostok ice core was recovered from the Antarctic ice sheet at Vostok Station in East Antarctica. Analysis of the ice and the gases trapped within it provides evidence of changes in Antarctic temperatures and atmospheric composition over approximately 420,000 years.
Temperature changes are reconstructed from variations in the isotopic composition of the ice. These reconstructions concern temperatures in Antarctica and are not direct measurements of global average temperatures.
Atmospheric carbon dioxide concentrations are measured from ancient air trapped within the ice. Because carbon dioxide is a relatively well-mixed atmospheric gas, these measurements provide evidence of atmospheric conditions extending far beyond Antarctica.
The Vostok record documents successive glacial and interglacial periods, accompanied by substantial changes in Antarctic temperatures and atmospheric carbon dioxide concentrations.

Vostok Antarctic ice-core record showing reconstructed temperature and atmospheric carbon dioxide over approximately 420,000 years. Source: Petit and colleagues (1999), Nature.
Atmospheric Carbon Dioxide and Temperature: Cause, Effect, or Feedback?
The Vostok record demonstrates a close correspondence between changes in Antarctic temperature and atmospheric carbon dioxide concentrations over successive glacial and interglacial periods. The correspondence raises an important scientific question concerning the temporal relationship between these variables.
Does an increase in atmospheric carbon dioxide precede an increase in temperature, or does an increase in temperature precede an increase in atmospheric carbon dioxide? The answer requires examination of the timing of the changes, the geographical extent of the temperature observations, and the uncertainties associated with dating ancient ice and the air trapped within it.
Investigations of Antarctic ice cores have found that changes in temperature and atmospheric carbon dioxide concentrations do not always occur simultaneously. During a transition from glacial conditions approximately 240,000 years ago, Antarctic warming preceded an increase in atmospheric carbon dioxide by an estimated 800 ± 200 years. The original scientific investigation documents this difference in timing.
Changes in ocean circulation, winds, and sea ice influence the transfer of heat between the oceans and atmosphere and its redistribution throughout the climate system. These processes also affect the exchange of carbon dioxide between the oceans and atmosphere. Research examining the relationship between Southern Ocean circulation, Antarctic temperature, and atmospheric carbon dioxide describes the physical processes involved.
During the transition from the last glacial period to the present interglacial period, atmospheric carbon dioxide concentrations and temperatures increased substantially, but these changes did not occur simultaneously everywhere.
Antarctic ice-core records show that warming began before atmospheric carbon dioxide concentrations increased during certain intervals, but no direct measurements of global temperature exist for this period. Estimates of the sequence of global temperature and atmospheric carbon dioxide changes are reconstructed from ocean sediments, ice cores, and other geological records obtained from different geographical locations, reflecting different environmental conditions and subject to uncertainties in their estimated ages.
An investigation of Antarctic temperature and atmospheric carbon dioxide during the last deglaciation found that increases in carbon dioxide probably followed regional Antarctic warming by less than 400 years, although uncertainties in the chronology did not exclude a small carbon dioxide lead.
The following illustration compares Antarctic temperature reconstructions with atmospheric carbon dioxide measurements during the last deglaciation.
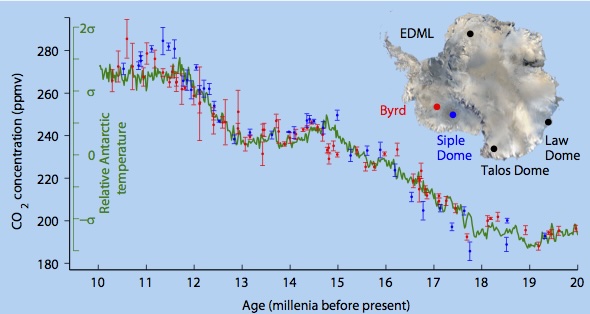
Antarctic temperature and atmospheric carbon dioxide during the last deglaciation, approximately 20,000–10,000 years ago. The illustration compares a reconstruction of regional Antarctic temperature with atmospheric carbon dioxide measurements from the Byrd and Siple Dome ice cores. Source: Pedro, Rasmussen, and van Ommen (2012), Climate of the Past. Illustration: Australian Antarctic Division.
Refining the time scale further, consider the Vostok observations over the last 50 thousand years.
The following illustration was constructed directly from the Vostok temperature reconstruction and atmospheric carbon dioxide measurements archived by the National Oceanic and Atmospheric Administration (NOAA). The temperature reconstruction uses the age of the ice, while the carbon dioxide measurements use the estimated age of the trapped air.
The plotted lines connect successive observations without applying a smoothing procedure or generating additional intermediate data points.
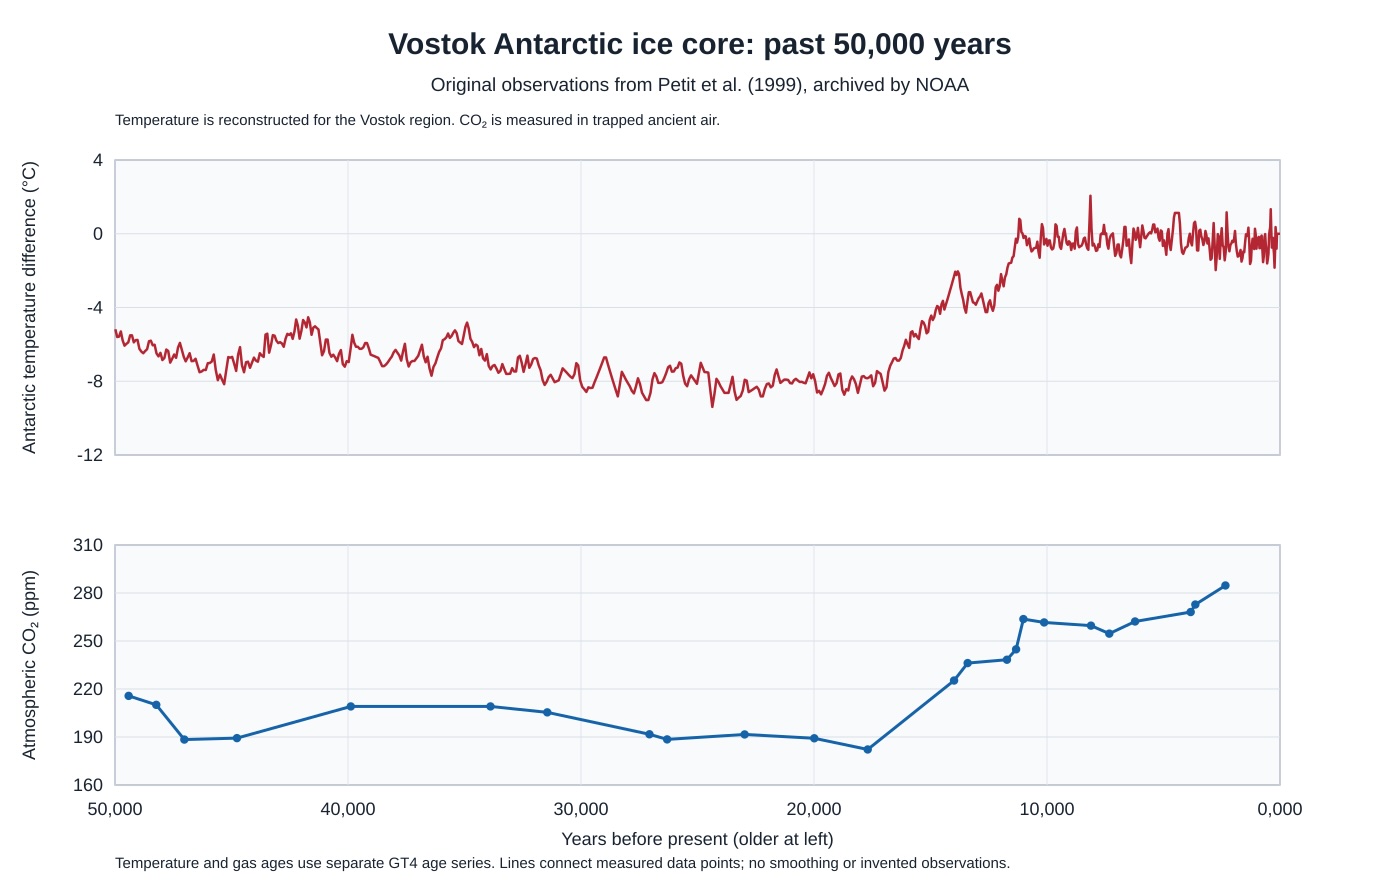
Vostok Antarctic ice-core record for the past 50,000 years. Reconstructed Antarctic temperature and measured atmospheric carbon dioxide concentrations. Source: Petit and colleagues (1999), Nature, NOAA Paleoclimatology archive.
From the perspective of these long geological records, we can examine the climate of the last 10,000 years in greater detail.
The Greenland ice cores provide evidence of climate variations in a different polar region. Although both Antarctic and Greenland ice cores preserve evidence of major climatic changes, the timing and magnitude of regional temperature variations are not necessarily identical.
The Greenland Ice Sheet Project 2 (GISP2) ice core provides evidence of temperature changes in central Greenland. It is a regional climate record and not a direct measurement of global temperatures.
The Greenland record indicates that temperatures in central Greenland were generally warmer during substantial portions of the early and middle Holocene than during many subsequent centuries.

Greenland GISP2 ice core, the last 10,000 years
The Greenland ice-core record also shows a long-term cooling trend over much of the last 4,000 years, interrupted by shorter periods of warming.

Greenland GISP2 temperature reconstruction over the last 4,000 years
The Atmospheric Greenhouse Effect
The greenhouse effect is a physical process involving the absorption and emission of infrared radiation by certain atmospheric gases and clouds. Solar radiation reaches the Earth’s surface, where some of its energy is absorbed and converted to heat. The warmed surface emits infrared radiation. Greenhouse gases absorb and emit infrared radiation in all directions. They alter the altitude and temperature from which radiation escapes to space, influencing the balance between incoming solar energy and outgoing infrared radiation.
The resulting surface temperature is higher than it would be without the atmospheric greenhouse effect. The strength of that effect depends on atmospheric composition, temperature, cloud properties, and interactions among the Earth’s physical and biological systems.
The greenhouse effect is one component of the planetary energy balance. Surface temperatures also depend on the amount of solar radiation absorbed, the reflection of incoming radiation, and the redistribution of energy within the atmosphere, oceans, and land.

Greenhouse gases participate in atmospheric exchanges and chemical transformations operating over timescales ranging from days to millions of years. Biological processes, exchanges between the oceans and atmosphere, and geological processes influence atmospheric concentrations through different mechanisms. The relative importance of these processes varies among greenhouse gases. Human activities also affect atmospheric greenhouse gas concentrations through fossil fuel combustion, changes in land use, agriculture, and industrial processes.

The quantities of greenhouse gases released into the atmosphere must be distinguished from changes in their atmospheric concentrations. Natural processes continuously release and remove substantial quantities of carbon dioxide. The atmospheric concentration changes when total additions and removals are not balanced. Human activities introduce additional carbon dioxide into this dynamic system, and a portion of those emissions accumulates in the atmosphere when total emissions exceed total removals.
The warming influence of each gas depends on its absorption characteristics, atmospheric abundance, and persistence.
Carbon dioxide is exchanged naturally in large quantities among the atmosphere, oceans, vegetation, and soils. Over long periods, geological processes also influence the carbon cycle. Human activities add carbon dioxide to these exchanges, increasing atmospheric concentrations when emissions exceed the additional quantities removed by natural processes.
Different greenhouse gases absorb infrared radiation at different wavelengths. Because some of their absorption bands overlap, their individual contributions to the greenhouse effect cannot simply be added together without accounting for those interactions. Overlapping absorption bands influence the additional radiative effect produced by changes in the concentration of any particular gas. The resulting effect depends on atmospheric conditions, including temperature, pressure, and the wavelengths involved.

The absorption spectrum of each greenhouse gas identifies wavelengths at which its molecules interact with infrared radiation. The resulting atmospheric absorption depends not only on these molecular characteristics but also on gas concentrations, atmospheric pressure, temperature, and the distance radiation travels through the atmosphere. Overlapping absorption bands create interactions among the effects of different gases. Consequently, the greenhouse effect of the atmosphere cannot be determined simply by adding the absorption characteristics of its individual components.
The importance of atmospheric composition becomes particularly apparent when comparing Earth with its neighboring planets.

Mars: A weak greenhouse effect
Mars has an atmosphere composed predominantly of carbon dioxide, but its atmospheric pressure is less than one percent of Earth’s atmospheric pressure at sea level.
Although carbon dioxide produces some greenhouse warming on Mars, the effect is limited by the thin atmosphere. Mars also receives less solar radiation than Earth because it is farther from the Sun. Its surface temperatures are consequently much lower than those generally experienced on Earth.

Venus: An extreme greenhouse effect
Venus has an atmosphere composed predominantly of carbon dioxide, but its surface atmospheric pressure is approximately 92 times that of Earth at sea level. The exceptionally dense atmosphere of Venus produces an extreme greenhouse effect. Its enormous atmospheric mass, infrared opacity, and vertical temperature structure contribute to an average surface temperature of approximately 465°C (869°F), sufficiently hot to melt lead. Although Venus receives more solar radiation at the top of its atmosphere than Earth, its highly reflective clouds prevent most of that radiation from reaching the surface. The extreme surface temperature results from the interaction of atmospheric composition, pressure, radiation, and the vertical structure of the atmosphere.
Atmospheric pressure, greenhouse gas abundance, and the absorption properties of atmospheric gases influence the strength of the greenhouse effect. Solar radiation, cloud properties, and other planetary characteristics also influence surface temperatures.
On Earth, water vapor, clouds, carbon dioxide, methane, nitrous oxide, and several other gases contribute to the atmospheric greenhouse effect.
Water vapor is the most abundant greenhouse gas and contributes substantially to the natural atmospheric greenhouse effect. The amount of water vapor that air can contain before becoming saturated increases strongly with temperature. Actual atmospheric water vapor concentrations also depend on evaporation, condensation, precipitation, and atmospheric circulation. Because atmospheric water vapor responds rapidly to changes in temperature and the hydrological cycle, it commonly operates as a climate feedback. Carbon dioxide and other long-lived greenhouse gases can produce more persistent changes in the Earth’s energy balance, while changes in atmospheric water vapor can amplify the resulting temperature changes.
Clouds have a more complicated influence. They can reflect incoming solar radiation, producing a cooling effect, while also absorbing and emitting infrared radiation, contributing to warming. Their overall influence depends on their altitude, composition, thickness, and geographic distribution.

Greenhouse gas molecules (NASA)
The principal greenhouse gases include the following.
- Water vapor. Water vapor is the most abundant greenhouse gas in Earth’s atmosphere and an important component of the natural greenhouse effect. Its concentration responds rapidly to changes in atmospheric temperature and the movement of water through evaporation, condensation, and precipitation.
- Carbon dioxide (CO2). Carbon dioxide is a relatively small component of the atmosphere but an important greenhouse gas. Natural sources include respiration, decomposition, volcanic activity, and exchanges with the oceans. Natural removal processes include photosynthesis, ocean uptake, and geological processes. Human activities, particularly fossil fuel combustion, cement production, and land use changes, have increased atmospheric carbon dioxide concentrations.
- Methane. Methane is a greenhouse gas released through natural processes, including microbial activity in wetlands, and through human activities involving agriculture, livestock, waste disposal, fossil fuel production, and transportation. Methane absorbs infrared radiation efficiently and has a substantially greater warming influence per unit mass than carbon dioxide when compared over a specified period. This comparison is commonly expressed as global warming potential, which measures the cumulative radiative influence of a greenhouse gas relative to carbon dioxide over a selected time horizon. The numerical comparison depends on the period selected. Methane has a much shorter average atmospheric lifetime than carbon dioxide, approximately 12 years, because chemical reactions gradually remove it from the atmosphere.
- Nitrous oxide (N2O). Nitrous oxide is a long-lived greenhouse gas produced by natural microbial processes in soils and oceans. Human activities increase emissions through agricultural soil management, the use of nitrogen fertilizers, certain industrial processes, and combustion. Nitrous oxide has an average atmospheric lifetime of approximately 110 years, substantially longer than that of methane. Its persistence allows changes in atmospheric concentrations to influence the Earth’s energy balance over extended periods. Nitrous oxide also participates in atmospheric chemical processes contributing to the destruction of stratospheric ozone. Nitrous oxide is chemically distinct from the reactive nitrogen oxides, principally nitric oxide (NO) and nitrogen dioxide (NO2), which influence atmospheric chemistry and climate through different mechanisms.
- Chlorofluorocarbons (CFCs). Chlorofluorocarbons are synthetic compounds formerly used extensively in refrigeration, air conditioning, aerosol products, and industrial applications. They are powerful greenhouse gases and contribute to the destruction of stratospheric ozone. Their production and consumption have been substantially restricted under the Montreal Protocol, although previously released compounds remain in the atmosphere because of their long atmospheric lifetimes. Several classes of compounds have been developed as substitutes. Hydrochlorofluorocarbons (HCFCs) generally have lower ozone-depleting potential than chlorofluorocarbons but still contribute to ozone depletion and greenhouse warming. Hydrofluorocarbons (HFCs) do not contain chlorine and consequently do not directly deplete stratospheric ozone, but many are powerful greenhouse gases. More recently developed substitutes, including certain hydrofluoroolefins (HFOs), have substantially lower global warming potentials, although their environmental effects depend on their chemical properties and atmospheric transformation products.
The atmospheric greenhouse effect results from the interaction of solar radiation, infrared radiation, atmospheric composition, temperature, and clouds. Biological, chemical, and geological processes influence the concentrations of greenhouse gases over different timescales. Changes in atmospheric composition alter the absorption and emission of infrared radiation, while changes in temperature, water vapor, and clouds can modify the resulting effects. Understanding the greenhouse effect requires consideration of these interacting physical and chemical processes.
Climate drivers: First-, second-, third-, and fourth-order climate controls
Climate drivers vary in magnitude, duration, and the timescales over which their effects become apparent. Some processes operate over billions of years, while others produce measurable climatic effects over centuries, decades, or shorter periods.
Lee C. Gerhard, William E. Harrison, and Bernold M. Hanson proposed a conceptual model that organizes climate drivers into four orders according to the approximate magnitude of their associated temperature changes and the timescales over which they operate.
The model provides a means of visualizing, within a single graphic, the enormous differences in the duration and magnitude of the physical processes that influence climate. It places geological and astronomical processes operating over millions or billions of years alongside processes operating over much shorter periods.
The accompanying illustration represents the estimated ranges of temperature change and duration associated with these processes. The diamond shapes represent ranges interpreted from the scientific literature, while the dots indicate additional possible ranges. The estimates have substantial uncertainties.
The four-order classification is a conceptual framework for comparing climate drivers. It illustrates the relationship between the magnitude of their effects and the timescales involved without suggesting that duration alone determines the magnitude of a climatic response.
The horizontal axis represents the estimated magnitude of temperature change associated with each climate driver, expressed on an arithmetic scale. The vertical axis represents the timescale over which the driver operates, expressed on a logarithmic scale in powers of ten. These different scales permit processes operating over vastly different periods to be compared within a single illustration.

Climate Effects Duration
First-order climate controls
First-order climate controls are the fundamental astronomical and planetary processes that influence climate over billions of years. In the conceptual model proposed by Gerhard, Harrison, and Hanson, these controls include solar luminosity, the astronomical relationship between Earth and the Sun, and the development and evolution of the atmosphere and its greenhouse effect.
Solar luminosity. The Sun provides the energy that drives the climate of Earth. Its luminosity has changed during the history of the solar system as nuclear fusion gradually alters the composition and internal structure of the Sun. Stellar evolution models indicate that the young Sun was approximately 25–30 percent less luminous than the present Sun. Solar luminosity has increased gradually over billions of years, changing the amount of radiant energy available to the planet.
Geological evidence indicates that liquid water existed on the surface when the Sun was substantially less luminous than it is today. This apparent contradiction, commonly called the faint young Sun paradox, demonstrates that solar luminosity alone cannot explain the geological history of surface temperatures.
Planetary geometry. The amount of solar radiation intercepted by Earth depends on the luminosity of the Sun, the distance between Earth and the Sun, and the geometry of the planet. The approximately spherical shape of Earth distributes incoming solar radiation unevenly across its surface. Planetary rotation, axial inclination, and orbital characteristics influence the geographic and seasonal distribution of solar energy. These astronomical relationships provide the physical setting within which atmospheric and oceanic processes redistribute heat.
Changes in orbital characteristics generally operate over much shorter periods than the billions of years associated with first-order controls. They are considered separately among the climate controls operating over intermediate timescales. The first-order significance of planetary geometry lies in the fundamental relationship between the planet and its principal source of energy, the sun.
Atmospheric development. The atmosphere of Earth has changed substantially since the formation of the planet approximately 4.54 billion years ago. Volcanic outgassing, chemical reactions involving rocks and oceans, biological activity, and the exchange of gases among the atmosphere, hydrosphere, and lithosphere have influenced its composition over geological time.
Greenhouse gases absorb and emit infrared radiation, altering the rate at which energy escapes to space. The atmospheric greenhouse effect raises the average surface temperature above the temperature that would result from the same absorbed solar radiation without greenhouse warming. In the conceptual model of Gerhard, Harrison, and Hanson, the magnitude of this effect is represented by an estimated temperature difference of approximately 20–40°C (36–72°F). This range should be understood as part of their conceptual classification rather than as a fixed value throughout geological history.
Atmospheric composition has also changed through interactions with the oceans, rocks, and living organisms. Carbon dioxide participates in geological and biological cycles, while the development of photosynthetic organisms altered atmospheric oxygen concentrations. These changes affected atmospheric chemistry and the conditions under which greenhouse gases influenced planetary temperatures.
Interactions among first-order controls. Solar luminosity, planetary geometry, and atmospheric composition do not operate independently. Changes in the energy received from the Sun interact with atmospheric absorption and emission of radiation, planetary reflectivity, and the exchange of energy among the atmosphere, oceans, and surface.
The geological persistence of liquid water demonstrates the importance of these interactions. Over billions of years, the increasing luminosity of the Sun has operated alongside changes in atmospheric composition, surface conditions, and the geological carbon cycle. Together, these processes have influenced the long-term thermal conditions of Earth.
First-order climate controls establish the fundamental astronomical and planetary conditions within which the other orders of climate controls operate. Their characteristic timescales extend across substantial portions of geological history, but their climatic effects depend on interactions among the physical, chemical, and biological processes affecting the planet.
Second-order climate controls
Second-order climate controls involve geological processes that change the distribution of continents and oceans, the configuration of ocean basins, and the circulation of water and heat around Earth. These processes operate principally over tens to hundreds of millions of years. In the conceptual model proposed by Gerhard, Harrison, and Hanson, second-order controls are associated with estimated global temperature variations of approximately 10–25°C (18–45°F).
Continental configuration and plate tectonics. The continents and ocean basins continually change their geographic positions and configurations through the movement of tectonic plates. Continental drift alters the distribution of land and water between equatorial and polar regions, opens and closes ocean passages, and changes the pathways available for ocean circulation.
These changes influence the geographic distribution of solar energy absorbed by the surface, the transfer of heat between low and high latitudes, and the exchange of energy and moisture between the oceans and atmosphere. The arrangement of continents also affects the development of continental ice sheets by determining the availability of land at high latitudes.
Ocean circulation and heat distribution. Ocean currents transport substantial quantities of thermal energy across the planet. Their direction, intensity, and geographic extent depend on the configuration of ocean basins, prevailing winds, differences in seawater density, and the rotation of Earth.
Gerhard and Harrison emphasized the importance of equatorial ocean circulation in their interpretation of long-term climate changes. They proposed that continental configurations permitting extensive equatorial circulation favor warmer global climatic conditions, while configurations that interrupt those circulation pathways can contribute to the development of icehouse conditions.
Under this interpretation, the obstruction of equatorial currents changes the distribution of oceanic heat and can promote circulation patterns that transfer warm water toward higher latitudes. These changes influence evaporation, atmospheric moisture transport, precipitation, and the accumulation or melting of snow and ice.
The relationship is not determined by ocean circulation alone. The formation and persistence of continental ice sheets also depend on atmospheric temperatures, snowfall, summer melting, atmospheric composition, and the geographic distribution of land. Ocean circulation interacts with these processes rather than independently determining the climatic state of the planet.
Greenhouse and icehouse conditions. The geological record contains evidence of extended intervals characterized by relatively warm global conditions and other intervals during which extensive continental ice sheets developed.
Geologists commonly describe these contrasting conditions as greenhouse and icehouse climatic states. A greenhouse state generally has relatively warm global temperatures and little or no permanent continental ice, while an icehouse state includes substantial permanent ice sheets.
Evidence of ancient glaciation occurs in rocks approximately 2.9 billion years old, and additional glacial deposits document major episodes during the Paleoproterozoic and Neoproterozoic eras. The Neoproterozoic glaciations occurred during the later Precambrian, particularly between approximately 720 and 635 million years ago.
During the Phanerozoic Eon, which began approximately 541 million years ago, Earth experienced several major climatic transitions. The Devonian Period, approximately 419–359 million years ago, included extensive intervals of relatively warm conditions. The Late Paleozoic Ice Age developed during the Carboniferous and continued into the Permian. Much of the Cretaceous Period, approximately 145–66 million years ago, was characterized by greenhouse conditions.
Following the Cretaceous, Earth underwent a prolonged series of climatic changes that eventually produced the present icehouse state. Permanent Antarctic glaciation developed near the Eocene–Oligocene boundary approximately 34 million years ago, while extensive Northern Hemisphere glaciation became established much later.
These transitions demonstrate that greenhouse and icehouse conditions have occurred repeatedly during geological history. Their development reflects interactions among continental configuration, ocean circulation, atmospheric composition, geological carbon cycling, and the growth or disappearance of continental ice sheets.
Geological carbon cycling. Plate tectonics also influences climate through processes affecting atmospheric carbon dioxide concentrations. Volcanic activity releases carbon dioxide from geological reservoirs, while chemical weathering of rocks removes carbon dioxide through reactions involving water and minerals.
Over geological timescales, the balance among volcanic emissions, chemical weathering, sedimentation, and the burial and transformation of carbon-bearing materials influences atmospheric carbon dioxide concentrations. Continental uplift and mountain building can increase the exposure of rocks to chemical weathering, while changes in continental position and climate alter the rates at which these reactions occur.
These processes connect the movement of tectonic plates with atmospheric composition and the greenhouse effect. Their influence on climate operates through interactions among the lithosphere, hydrosphere, atmosphere, and biosphere.
Magnitude and duration of second-order controls. The geological processes associated with second-order climate controls operate over millions to hundreds of millions of years. Their effects accumulate through changes in continental geography, ocean circulation, atmospheric composition, and the distribution of continental ice.
The temperature ranges represented in the Gerhard conceptual model illustrate the substantial climatic changes associated with these geological processes. They should be understood as approximate estimates rather than fixed limits applicable to every geological transition.
Second-order climate controls demonstrate how changes in the physical configuration of Earth can alter the movement of heat, the composition of the atmosphere, and the distribution of ice over geological time.
Third-order climate controls
Third-order climate controls involve recurring astronomical variations and interactions among the atmosphere, oceans, and continental ice sheets. These processes operate principally over thousands to hundreds of thousands of years. They influence the geographic and seasonal distribution of solar radiation and contribute to the alternation between glacial and interglacial climatic conditions.
Orbital variations. The orbit and rotational orientation of Earth undergo periodic changes resulting from gravitational interactions with the Sun, Moon, and other planets. These variations affect the geographic and seasonal distribution of incoming solar radiation. Their climatic consequences are examined in the section on Milankovitch Cycles and Glaciation.
Three principal orbital variations contribute to these recurring changes. Orbital eccentricity alters the shape of the orbit of Earth, with important periodicities near 100,000 and 405,000 years. Axial inclination changes the angle between the rotational axis of Earth and its orbital plane over approximately 41,000 years. Precession changes the relationship between the seasons and the position of Earth along its orbit, producing important climatic periodicities of approximately 19,000 to 23,000 years.
Solar radiation and climatic response. Orbital variations influence climate principally by changing the seasonal and geographic distribution of incoming solar radiation rather than producing large changes in the globally averaged annual solar energy received by Earth. The physical significance of incoming solar energy is discussed in Irradiance—Incident Solar Energy—Varies and The Energy Budget of the Earth.
Glaciation and surface reflectivity. Changes in summer solar radiation at high latitudes influence the accumulation and melting of continental ice sheets. When snow and ice expand, their greater reflectivity reduces the absorption of incoming solar radiation and can reinforce cooling. Retreating ice exposes darker surfaces that absorb more solar energy and can reinforce warming. These interactions are explained further in Albedo and Milankovitch Cycles and Glaciation.
Ocean circulation and atmospheric interactions. The climatic effects of orbital variations interact with changes in ocean circulation, atmospheric composition, and the exchange of energy between the oceans and atmosphere. The mechanisms governing these exchanges are examined in The Coriolis Effect and Ocean Currents, The Thermohaline Circulation, and The Carbon Cycle.
Evidence from the geological record. Marine sediments, ice cores, and other geological records preserve evidence of recurring climatic changes associated with orbital variations. The methods used to investigate these changes are discussed in Reconstructing Paleoclimate, Oxygen Isotopes as Paleoclimate Proxies, and Paleoclimate from Benthic Organisms.
Magnitude and duration of third-order controls. Third-order climate controls illustrate how recurring variations in astronomical conditions can initiate climatic responses extending over thousands to hundreds of thousands of years. The magnitude of the resulting temperature changes depends on interactions among solar radiation, atmospheric composition, ocean circulation, surface reflectivity, and continental ice sheets.
Within the Gerhard, Harrison, and Hanson conceptual model, third-order controls occupy an intermediate position between geological processes operating over millions of years and shorter-duration climatic influences operating over years to centuries. The classification provides a framework for comparing the characteristic timescales and temperature effects of these processes.
Fourth-order climate controls
Fourth-order climate controls include processes that produce climatic variations over relatively short periods, ranging from individual years to centuries. In the conceptual classification proposed by Gerhard, Harrison, and Hanson, these controls generally involve smaller temperature changes than those associated with the longer geological processes discussed in the preceding sections. The classification provides a means of comparing the characteristic duration and magnitude of climatic influences rather than establishing an absolute limit on their effects.
Fourth-order controls include variations in solar activity, volcanic eruptions, changes in ocean circulation, and certain changes in land cover. These processes differ in their physical mechanisms, geographic extent, and duration. Some alter the amount of energy absorbed or retained by Earth, while others redistribute energy already present within the atmosphere and oceans.
Solar activity. The energy emitted by the Sun varies over time. Changes in solar magnetic activity produce measurable variations in solar irradiance, including the approximately 11-year sunspot cycle. Longer variations in solar activity have also been identified through historical observations and indirect geological and biological evidence.
The physical characteristics and climatic significance of these variations are discussed in Solar Activity Cycles from 1749, Solar Activity Affects Climate, The Solar Magnetic Activity Cycle, Sunspots, and Solar Activity Proxies.
Solar activity can influence climate through changes in incoming radiation. The magnitude of the resulting temperature response depends on the amount of additional or reduced energy received, the duration of the variation, and interactions with atmospheric and oceanic processes. Individual solar flares and solar storms primarily affect the upper atmosphere and near-Earth electromagnetic environment; they are not established causes of substantial changes in global surface temperature.
Volcanic activity. Major volcanic eruptions can influence climate when they inject sulfur dioxide into the stratosphere. Chemical reactions convert the sulfur dioxide into sulfate aerosols that scatter incoming sunlight and reduce the amount of solar energy reaching the surface.
The 1883 eruption of Krakatoa produced atmospheric effects that persisted for several years. The 1991 eruption of Mount Pinatubo in the Philippines also injected substantial quantities of sulfur dioxide into the stratosphere. The resulting sulfate aerosols contributed to a temporary reduction in global average surface temperature of approximately 0.4–0.6°C (0.7–1.1°F) during the period following the eruption.
The climatic influence of an eruption depends on the quantity of sulfur dioxide reaching the stratosphere, the altitude and geographic location of the injection, atmospheric circulation, and the persistence of the resulting aerosols. Volcanic effects on global temperature are generally temporary because the aerosols are gradually removed from the atmosphere.
Ocean circulation and short-term climatic variations. The oceans store and transport enormous quantities of thermal energy. Variations in ocean circulation and exchanges of heat between the ocean and atmosphere can influence surface temperatures, precipitation, and atmospheric circulation over periods ranging from months to decades.
El Niño and La Niña are opposite phases of the El Niño–Southern Oscillation, a recurring pattern of coupled oceanic and atmospheric variations centered in the tropical Pacific Ocean. El Niño conditions generally involve unusually warm surface waters in the central and eastern equatorial Pacific, while La Niña conditions involve unusually cool surface waters in those regions.
These variations affect atmospheric circulation and precipitation over extensive geographic areas. They also influence global average surface temperature by changing the distribution and exchange of heat between the oceans and atmosphere.
The physical mechanisms involved in ocean circulation are discussed in The Coriolis Effect and Ocean Currents, Geostrophic Balance, The Thermohaline Circulation, and Temperature-Density Effects.
Changes in land cover. Changes in vegetation, soil exposure, agricultural land use, deforestation, and urban development can influence local and regional climatic conditions. These changes affect surface reflectivity, evaporation, the movement of moisture into the atmosphere, and the exchange of heat between the surface and surrounding air.
Urban development frequently replaces vegetation and permeable soil with buildings, pavement, and other surfaces that absorb and retain solar energy. These changes can produce urban heat islands in which temperatures differ substantially from those of surrounding rural areas.
Deforestation can alter surface reflectivity, evapotranspiration, atmospheric moisture, and the exchange of carbon between vegetation and the atmosphere. The resulting climatic effects depend on geographic location, the characteristics of the vegetation removed, and the nature of the replacement land cover.
The role of surface reflectivity is discussed in Albedo, while the exchange of carbon among the atmosphere, oceans, vegetation, and geological reservoirs is examined in The Carbon Cycle.
Magnitude and duration of fourth-order controls. Fourth-order climatic influences differ substantially in magnitude and persistence. Volcanic aerosols can produce temporary global cooling, ocean circulation variations can redistribute heat and alter regional weather patterns, solar variability can change incoming radiation, and changes in land cover can modify local and regional exchanges of energy and moisture.
These processes may operate simultaneously. Their climatic effects can reinforce or oppose one another, and the resulting temperature changes may differ substantially among geographic regions.
Within the Gerhard, Harrison, and Hanson conceptual framework, fourth-order controls occupy the portion of the classification associated with relatively short timescales and generally smaller temperature variations. Their importance lies not only in the magnitude of individual effects but also in the interactions among the physical processes that influence climate over years, decades, and centuries.
The Sun and Earth’s Climate
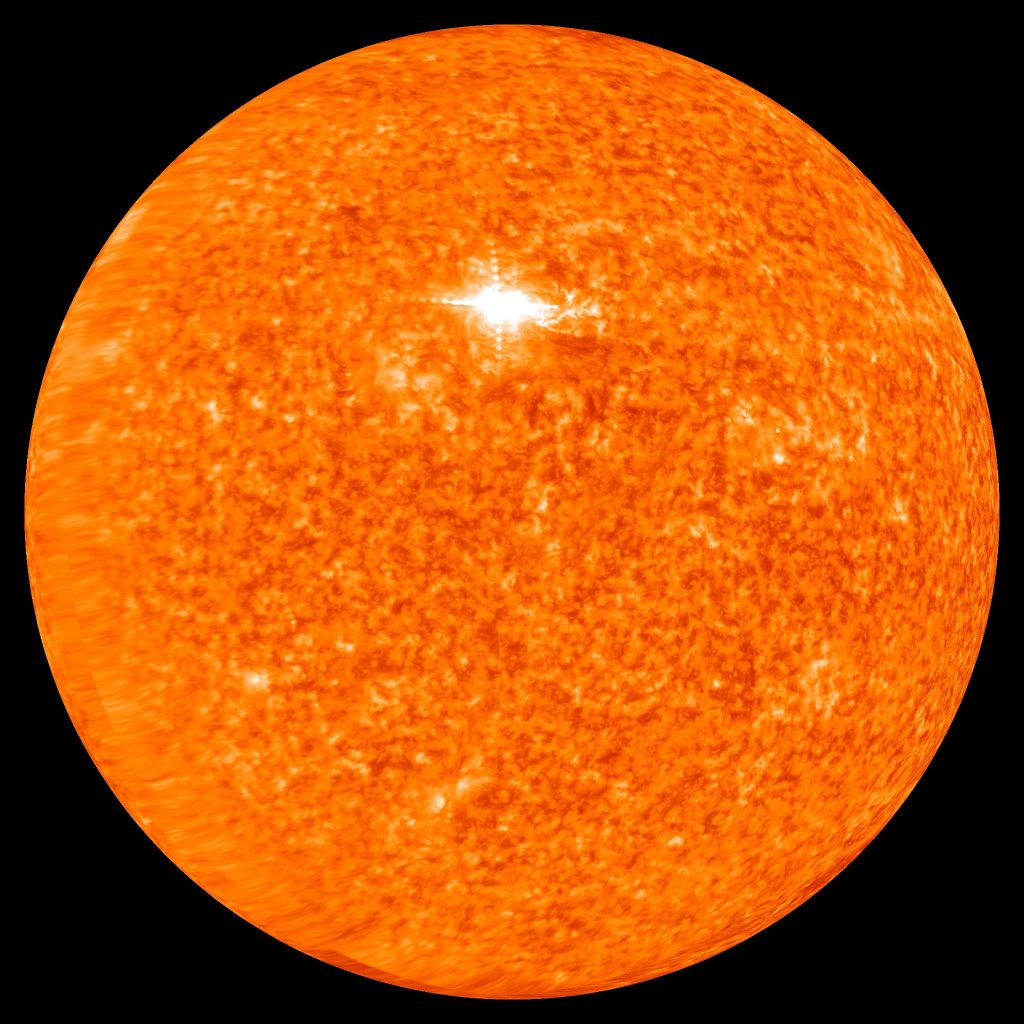
The Sun observed in ultraviolet light by NASA’s Solar Terrestrial Relations Observatory (STEREO). Credit: NASA Scientific Visualization Studio.
The Sun is the principal source of energy driving the climate of Earth. Solar radiation supplies the energy that heats the surface and atmosphere, drives atmospheric circulation, powers evaporation and the hydrological cycle, and contributes to the movement of thermal energy through the oceans.
The amount of solar energy received by Earth depends principally on the luminosity of the Sun and the distance between Earth and the Sun. The average distance is approximately 149.6 million kilometers (93 million miles). The amount of solar radiation intercepted by the planet also depends on its geometry, while the distribution of that radiation across the surface varies with latitude, season, and orbital characteristics.
Not all incoming solar radiation is absorbed. Clouds, atmospheric particles, ice, snow, oceans, vegetation, and other surfaces reflect a portion of the incoming energy back into space. The proportion reflected is known as albedo. The remaining energy is absorbed by the atmosphere, oceans, and land surfaces.
Earth emits energy toward space as infrared radiation. The atmospheric greenhouse effect alters the rate at which this energy escapes. The resulting surface temperature depends on the balance between absorbed solar radiation and outgoing radiation, together with the processes that distribute energy within the atmosphere and oceans. These relationships are examined in The Atmospheric Greenhouse Effect and The Energy Budget of the Earth.
The Sun during geological history. Solar luminosity has not remained constant throughout the history of the solar system. Models of stellar evolution indicate that the young Sun was approximately 25–30 percent less luminous than the present Sun. Its luminosity has gradually increased as nuclear fusion changes the composition and internal structure of the Sun.
During the early history of Earth, energy from accretion, large impacts, gravitational differentiation, and radioactive decay contributed to the heating and development of the planet. These internal sources of energy were important in the formation and evolution of the crust, mantle, and core, but they are distinct from the solar energy that principally drives surface climate.
The early atmosphere developed through geological processes, including the release of gases from the interior of Earth. Its composition subsequently changed through interactions among volcanic activity, the oceans, rocks, and living organisms. The concentrations of greenhouse gases have varied substantially over geological time, influencing the relationship between incoming solar radiation and surface temperature.
The long-term evolution of solar luminosity. Solar luminosity is expected to continue increasing over geological time. This gradual increase will influence the long-term energy balance of Earth and may eventually produce conditions incompatible with the persistence of liquid water at the surface.
Estimates of the remaining period of surface habitability depend on models of solar evolution, atmospheric composition, cloud behavior, and the geological carbon cycle. The precise timing of these changes remains uncertain.
Variations in incoming solar energy. Over shorter periods, the solar energy received by Earth varies because of changes in orbital characteristics and solar activity. Orbital eccentricity, axial inclination, and precession influence the geographic and seasonal distribution of solar radiation. These variations are examined in Milankovitch Cycles and Glaciation.
Solar magnetic activity also produces measurable variations in the energy emitted by the Sun. These variations occur over the approximately 11-year solar activity cycle and over longer intervals. Their characteristics are discussed in Irradiance, Solar Activity Cycles from 1749, and The Solar Magnetic Activity Cycle.
The climatic effects of variations in solar energy depend on their magnitude, duration, and geographic distribution, together with the responses of the atmosphere, oceans, ice, and land surfaces. Understanding these effects requires distinguishing changes in the energy received from the Sun from changes in the way that energy is absorbed, redistributed, and emitted by Earth.
Albedo
Albedo, from the Latin word meaning whiteness, measures the proportion of incoming solar radiation reflected by a surface or planetary body. It is an important factor in determining how much solar energy Earth absorbs and how much returns to space.
Albedo is dimensionless and is expressed on a scale from 0 to 1, or as a percentage. An albedo of 0 represents complete absorption of incident radiation, while an albedo of 1 represents complete reflection. A surface with an albedo of 0.30 reflects 30 percent of the incoming radiation and absorbs the remaining 70 percent, assuming that the surface is opaque.
Reflectance, irradiance, and radiosity. Irradiance is the radiant power received by a surface per unit area, expressed in watts per square meter (W/m2). Reflectance describes the fraction of incident radiation reflected by that surface.
Radiosity is the total radiant power leaving a surface per unit area. For an opaque surface, it includes both reflected incident radiation and thermal radiation emitted by the surface itself. Radiosity and reflected solar radiation are not interchangeable quantities. Albedo concerns the reflected portion of incoming solar radiation, not the total radiation leaving the surface.

Reflected incident radiation and emitted thermal radiation are the two components of radiosity from an opaque surface.
In the illustration, ε represents surface emissivity, σ is the Stefan–Boltzmann constant, T is the absolute temperature of the surface, and Ee represents incident irradiance. The emitted thermal radiation depends on emissivity and temperature, while the reflected component depends on the reflectance of the surface.
Solar radiation and surface reflectivity. Albedo depends on the wavelength and direction of incoming radiation, the physical characteristics of the reflecting surface, and the angle at which radiation strikes it. Measurements may represent conditions over seconds, days, months, or years.
The spectral distribution of incoming solar radiation also matters. Different surfaces reflect and absorb different proportions of ultraviolet, visible, and near-infrared radiation.
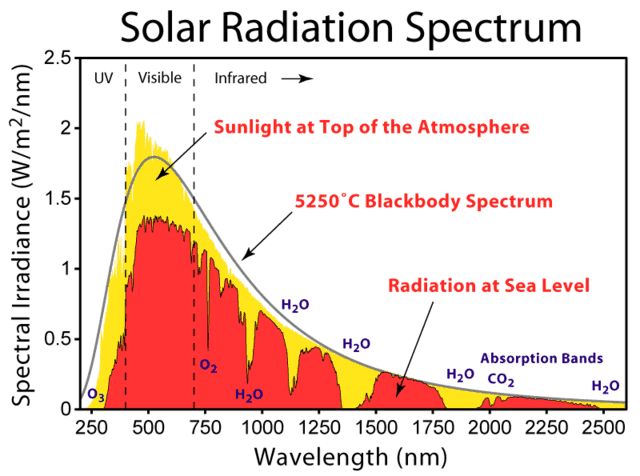
Solar albedo generally refers to reflection across the spectrum of incoming solar radiation. Measurements commonly emphasize wavelengths from approximately 0.3 to 3 micrometers (μm), which encompass most of the solar energy reaching the surface. Visible light occupies approximately 0.39–0.70 μm of this range.
Dark surfaces generally absorb a larger proportion of visible sunlight than bright surfaces. Vegetation, for example, often has relatively low visible-light reflectance, while fresh snow reflects a substantial proportion of incoming visible radiation. However, visual brightness alone does not determine total solar albedo because reflectance also varies outside the visible spectrum.
Albedo of different surfaces. Surface albedo varies considerably with material, texture, moisture, vegetation, snow cover, and the angle of incoming sunlight. Fresh snow generally has high albedo, while forests, dark soils, and open water under many illumination conditions have lower albedo.

Percentage of incoming sunlight reflected by different surfaces and environmental conditions.
Planetary albedo. The planetary albedo of Earth represents the fraction of incoming solar radiation reflected back into space by clouds, atmospheric particles, and the surface. Its global average is approximately 0.30, meaning that about 30 percent of incoming solar radiation is reflected and approximately 70 percent is absorbed.
Clouds make a substantial contribution to planetary albedo. Snow and ice also increase reflectivity, while oceans and vegetated surfaces generally absorb larger proportions of incoming solar energy. The planetary average varies over time as cloud cover, atmospheric conditions, and surface characteristics change.
Albedo and climate. Changes in albedo alter the amount of solar energy absorbed by Earth. Increasing reflectivity generally reduces absorbed solar energy, while decreasing reflectivity increases absorption.
This relationship is particularly important in regions covered by snow and ice. Cooling can increase snow and ice cover, raising surface reflectivity and reinforcing the initial cooling. Warming can reduce snow and ice cover, exposing darker surfaces that absorb more solar radiation and reinforce warming. This interaction is known as ice-albedo feedback.
Albedo determines the proportion of incoming solar radiation reflected back into space rather than absorbed by Earth. Changes in albedo alter the amount of solar energy available to heat the atmosphere, oceans, and land surfaces. These relationships are examined further in The Energy Budget of the Earth.
Irradiance—incident solar energy—varies
Solar irradiance is the radiant power received from the Sun per unit area, expressed in watts per square meter (W/m2). Total solar irradiance (TSI) measures the solar energy received across all wavelengths at the top of the atmosphere, conventionally expressed at the average distance between Earth and the Sun.
The energy emitted by the Sun is not constant. Solar irradiance varies over periods ranging from minutes and days to decades and longer intervals. The most familiar recurring variation is associated with the approximately 11-year solar activity cycle, during which the number of sunspots and other manifestations of solar magnetic activity increase and decrease.

Starting the next solar cycle
Direct measurements of solar irradiance. Since 1978, satellite instruments have provided a continuous series of overlapping measurements of total solar irradiance. These observations demonstrate that TSI generally increases by approximately 0.1 percent between solar minimum and solar maximum.
The average total solar irradiance at the mean distance between Earth and the Sun is approximately 1,361 W/m2. A variation of 0.1 percent represents a change of approximately 1.36 W/m2 in the solar radiation incident on a surface perpendicular to the incoming radiation at that distance.
Solar irradiance also varies over shorter periods as sunspots and bright magnetic regions rotate across the visible surface of the Sun. Sunspots temporarily reduce the radiation emitted from the regions they occupy, while bright magnetic structures known as faculae increase solar radiation. During periods of high solar activity, the increased emission associated with bright magnetic regions generally exceeds the reduction associated with sunspots.

These observations establish a measurable relationship between solar magnetic activity and the total radiant energy emitted by the Sun. The relationship is examined further in Solar Activity Cycles from 1749, The Solar Magnetic Activity Cycle, and Sunspots.
Reconstructing historical solar irradiance. Direct satellite measurements begin in 1978. Estimates of earlier solar irradiance must be reconstructed from indirect evidence.
Historical reconstructions have been developed using sunspot numbers, solar-cycle lengths, observations of solar magnetic activity, and cosmogenic isotopes such as carbon-14 and beryllium-10. These indicators provide information about past solar activity, but converting them into estimates of total solar irradiance requires assumptions about the relationship between magnetic activity and solar radiation.

Historical solar irradiance has been reconstructed from records of solar activity extending back to 1700. Statistical comparisons of these reconstructions with historical temperature records suggest a relationship between variations in solar energy output and changes in global temperature. However, the strength of that relationship remains uncertain because the reconstructions depend on indirect indicators of solar activity and the analysis did not account for all other influences on climate. Hoyt and Schatten (1993), A Discussion of Plausible Solar Irradiance Variations, 1700–1992.
Subsequent reconstructions have produced different estimates of the magnitude of historical solar irradiance changes. The differences arise from the selection of solar activity indicators, assumptions concerning the relationship between magnetic activity and irradiance, and methods used to combine historical observations with modern measurements.
Solar irradiance and historical climate. Historical observations provide evidence of climatic variations occurring during periods of unusually low or high solar activity. One frequently discussed interval is the Maunder Minimum, approximately 1645–1715, when very few sunspots were recorded.
The Maunder Minimum overlapped part of the broader period commonly called the Little Ice Age, during which several regions experienced relatively cool conditions. The temporal association has stimulated extensive investigation of possible solar influences on climate. However, historical climatic changes also reflect volcanic activity, ocean circulation, and other processes. Coincidence in timing does not, by itself, establish the magnitude of solar causation.

Statistical investigations of solar influences. Statistical modeling has been used to investigate whether reconstructed variations in solar irradiance can explain observed changes in global surface temperature between 1880 and 1993. These investigations examined the relationship between estimated solar energy output and historical temperature records using alternative solar irradiance reconstructions and climate model simulations. See Soon, Posmentier, and Baliunas (1996), Inference of Solar Irradiance Variability from Terrestrial Temperature Changes, 1880–1993: An Astrophysical Application of the Sun–Climate Connection.
Using a climate model and alternative solar irradiance reconstructions, the investigators reported that an optimized simulation using solar forcing alone accounted for approximately 71 percent of the variance in observed global surface temperatures during 1880–1993. Their calculations also suggested that the assumed solar irradiance changes could have been substantially larger than the variations directly measured during individual recent solar cycles.
The 71 percent figure represents the statistical variance explained by a particular model simulation. It does not establish that solar irradiance caused 71 percent of the observed temperature increase. The result depends on the reconstructed irradiance series, the model assumptions, and the methods used to optimize the simulation.
Other investigations using different irradiance reconstructions and modeling methods have produced different estimates of the climatic contribution of solar variability. The magnitude of historical solar influence must be evaluated by distinguishing directly measured changes in irradiance from reconstructed changes and from statistical estimates of their climatic consequences.
Physical mechanisms connecting solar variability and climate. Changes in total solar irradiance alter the energy received by Earth. The resulting climatic response depends on the fraction of incoming radiation absorbed, the duration of the variation, and the thermal response of the atmosphere, oceans, and land surfaces.
Solar variability also differs across wavelengths. Ultraviolet radiation exhibits proportionally greater variations over the solar cycle than total solar irradiance. Changes in ultraviolet radiation influence atmospheric chemistry and heating, particularly in the stratosphere. Interactions involving atmospheric circulation may transmit some of these effects to lower atmospheric levels.
Solar irradiance and orbital variations. The amount and geographic distribution of solar radiation received by Earth are also influenced by variations in its orbit and the orientation of its rotational axis. These astronomical variations, commonly known as Milankovitch cycles, include changes in orbital eccentricity, axial inclination, and precession. Their physical mechanisms and climatic consequences are examined in detail in the following sections.
Orbital eccentricity, axial inclination, and precession principally alter the geographic and seasonal distribution of incoming solar radiation. Their climatic significance is examined in Milankovitch Cycles and Glaciation.
The climatic effects of solar irradiance must ultimately be understood in relation to the energy absorbed and emitted by Earth. These relationships are examined in Albedo and The Energy Budget of the Earth.
Solar Magnetic Activity and Climate
Solar activity varies over time as a consequence of changes in the magnetic field of the Sun; the number and distribution of sunspots, the occurrence of solar flares, the emission of solar radiation, and the flow of charged particles into interplanetary space. Historical observations provide a record of these variations extending over several centuries.
The historical record of solar activity. Systematic records of sunspot observations have been used to reconstruct solar activity cycles extending back to the eighteenth century. The following illustration presents the succession of numbered solar cycles beginning in the period traditionally associated with Solar Cycle 1, which extended approximately from 1755 to 1766.

Solar Activity Cycles from 1749
The solar magnetic activity cycle. Solar activity exhibits a recurring cycle with an average duration of approximately 11 years, although the duration and intensity of individual cycles vary. Solar maximum and solar minimum identify periods of relatively high and low sunspot activity. Individual cycles are conventionally measured from one solar minimum to the next.
The approximately 11-year cycle is associated with changes in the magnetic field of the Sun. Sunspots are regions of intense magnetic activity that appear darker than the surrounding solar surface because they are cooler. Their number, size, and distribution vary throughout the cycle. Solar flares, magnetic disturbances, and other manifestations of solar activity also vary, although they do not all follow identical patterns.
Discovery and reconstruction of the solar cycle. The recurring variation in sunspot numbers was identified in 1843 through the examination of systematic observations extending over several decades. Subsequent compilation and analysis of historical observations established a longer record of solar activity and provided the basis for the numbered sequence of solar cycles still used today.
The historical sunspot record was extended backward through observations made during the eighteenth century and, with greater uncertainty, through records dating to the earliest telescopic observations in the seventeenth century. These records demonstrate that the amplitude and duration of solar cycles are variable rather than precisely periodic.
The Maunder Minimum. Between approximately 1645 and 1715, unusually few sunspots were recorded. This interval is known as the Maunder Minimum. The historical observations indicate a prolonged reduction in visible sunspot activity rather than a complete cessation of solar magnetic activity.
The Maunder Minimum is of particular interest because it overlapped part of the broader interval commonly called the Little Ice Age. The temporal relationship has encouraged investigation of possible connections between reduced solar activity and historical climatic variations. However, the climatic conditions of that period were also influenced by volcanic activity, ocean circulation, and other factors. The coincidence of reduced sunspot activity and regional cooling does not, by itself, establish the magnitude of the solar contribution.

400 years of Sunspot Numbers
The magnetic polarity cycle. Observations during the nineteenth century established that sunspots appear at different solar latitudes during successive stages of the activity cycle. Sunspots generally emerge at relatively higher latitudes near the beginning of a cycle and subsequently appear progressively closer to the solar equator.
In 1908, measurements of magnetic effects in sunspot spectra established that sunspots contain strong magnetic fields. Subsequent investigations demonstrated that sunspots commonly occur in groups with characteristic magnetic polarities. The magnetic orientation of these groups generally differs between the northern and southern solar hemispheres and reverses from one approximately 11-year cycle to the next.
As a result, the solar magnetic field generally requires two successive sunspot cycles, approximately 22 years, to return to the same polarity configuration. The familiar 11-year sunspot cycle is consequently one half of a more complete magnetic polarity cycle.
Successive 11-year cycles also differ in intensity. Historical observations have identified tendencies for alternating cycles to exhibit different levels of activity, although these relationships are not sufficiently consistent to constitute an invariant rule.
Solar activity and climate. Variations in solar activity can influence the terrestrial environment through several physical processes. Three principal categories of solar variability are relevant to investigations of possible climatic effects.
Total solar irradiance. Changes in total solar irradiance alter the radiant energy received by Earth. Direct satellite observations demonstrate that total solar irradiance varies by approximately 0.1 percent over a typical solar activity cycle. The resulting influence on climate depends on the amount of additional or reduced energy absorbed by Earth and the response of the atmosphere, oceans, and land surfaces. These relationships are examined in Irradiance—incident solar energy—varies.
Solar ultraviolet radiation. Solar ultraviolet radiation varies proportionally more than total solar irradiance over the activity cycle. These variations influence atmospheric chemistry, including the production and destruction of ozone, and alter heating in portions of the upper atmosphere. Changes in atmospheric temperature and circulation may transmit some of these effects to lower atmospheric levels.
Solar wind and atmospheric electrical processes. The solar wind consists primarily of charged particles emitted from the solar atmosphere. Variations in solar wind and associated magnetic activity influence the terrestrial magnetosphere and the near-Earth space environment. Proposed climatic mechanisms include changes in atmospheric electrical processes and possible relationships involving cosmic rays, cloud formation, and precipitation.
Solar wind and atmospheric electrical processes. The solar wind consists primarily of charged particles emitted from the solar atmosphere. Variations in solar wind and associated magnetic activity influence the terrestrial magnetosphere and the near-Earth space environment. Proposed climatic mechanisms include changes in atmospheric electrical processes and possible relationships involving cosmic rays, cloud formation, and precipitation.

Although solar influences on the magnetosphere and atmospheric ionization are established physical phenomena, the extent to which these processes produce significant changes in cloud cover, rainfall, or global temperature remains uncertain. Their climatic effects cannot be assumed to amplify changes in total solar irradiance without supporting observational evidence.
These solar variables operate through different physical mechanisms and over different timescales. Their combined climatic influence must be evaluated in relation to other factors affecting the energy balance and circulation of the Earth system.
The following sections examine the observational evidence underlying the reconstruction of solar activity, including Sunspots, Sunspots and Wolf Numbers, and Solar Activity Proxies.
Sunspots

sunspots and solar granules
A Sunspot is a temporary region where the solar magnetic field is particularly strong, inhibiting the normal surface convection activity of the Sun. It appears darker on the surface of the Sun because it is cooler than the material around it.

solar granules; convection cells in the solar plasma
Solar granules are the tops of convection cells in the solar plasma. The middle of each granule where hot plasma rises from below s lighter. This plasma moves outwards as it cools, then falls back into the depths at the darker edges of each granule. A typical granule is about 1,500 kilometers (930 miles) across, just over 10 percent of the diameter of Earth.
The Solar granules were first observed at the legendary RCA Communications Laboratories at Rocky Point, Long Island, New York just down the road from where Nikola Tesla built his Wardenclyffe laboratory. There in the Pine Barrens of Long Island, Dr. William A. Miller, an applied physicist and mathematician who later designed the camera which took the high altitude, high resolution photographs of the Russian missiles during the Cuban Missile Crisis of 1962, designed a solar observatory to observe the number and movement of sunspots which had a significant impact on worldwide radio communications. It was built around a unique horizontal telescope located at ground level.
The optics were fabricated by optical engineer and optician Ralph Franklin who had produced 1700 Amici roof prisms for the U.S. Army in his spare time after a full workday during World War II. The master machinist Oswin”Ozzie” Voight designed and fabricated the complex gearing system which tracked the sun during each photographic run and master welder and metal fabricator, Gerhard “Herbi” Herbst designed and fabricated the telescope structure itself.
The worldwide community of solar astrophysicists centered at a large solar telescope in France at that time scoffed at the idea that a ground level telescope in the flat, sea-level sandy plains of central Long Island could capture any meaningful data about the sun.
Shortly after sunrise on its test run, the first film from the telescope showed the actual birth of a sunspot and clearly identified the solar surface granules, then called rice grains.
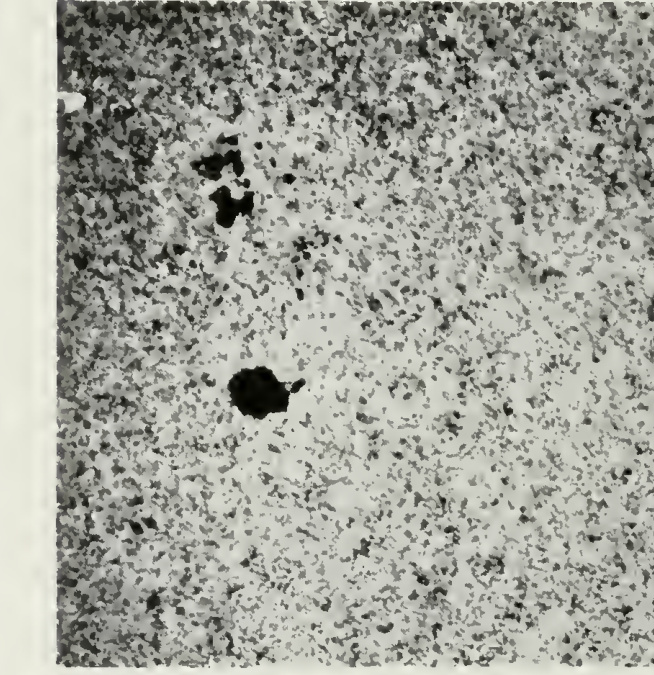
Dr. Miller postulated that the rice grains were the tops of convection cells and designed a lab bench experiment to test his theory. He covered the bottom of a large glass fish tank with a thin layer of india ink then filled the tank with water. The tank rested on an electrically heated iron plate which evenly heated the the water in the tank. A wide angle 16 mm Bolex motion picture camera mounted over the tank observed the surface of the water which soon took on the appearance of the rice grains of the solar surface as the wat er temperature rose. Moving the wide angle camera to photograph the rising india ink convection columns as they grew from the india ink along the floor of the fish tank, Dr. Miller quickly confirmed his theory which soon became accepted throughout the scientific community although its origins have been overlooked.
On the first day of its trial run, it produced the first photographic recording of the actual formation of a sunspot. “They Explore the Face of the Sun,” Radio Age, vol. 13, no. 3 (July 1954), pp. 20–23.
The lone sunspot that graced the face of the Sun on 30 July 2020.
In 1961 the father-and-son team of Harold and Horace Babcock established that the solar cycle is a spatiotemporal magnetic process unfolding over the Sun as a whole. They observed that the solar surface is magnetized outside of sunspots, that this (weaker) magnetic field is to first order a dipole, and that this dipole undergoes polarity reversals with the same period as the sunspot cycle. Horace’s Babcock Model described the Sun’s oscillatory magnetic field as having a quasi-steady periodicity of 22 years.

Reconstruction of solar activity over 11,400 years
It covered the oscillatory exchange of energy between toroidal and poloidal solar magnetic field ingredients.

A diagram depicting the poloidal (θ) direction, represented by the red arrow, and the toroidal (ζ) or (ϕ) direction, represented by the blue arrow.
Sunspots and Wolf numbers
The idea of computing sunspot numbers was originated by Rudolf Wolf in 1848 in Zurich, Switzerland and the international sunspot numbering procedure he initiated bears his name or sometimes its place, the Zurich number. The combination of sunspots and their grouping is used because it compensates for variations in observing small sunspots. The oldest continuous record of the activity of the Sun is provided by sunspot measurements, which have been made since A.D. 1610. The sunspot data from the past 400 years show that the sunspot number changes periodically, with a period of 11 years on average. This periodicity is called the Schwabe cycle.

Wolf sunspot number since 1750
Sunspot activity is cyclical and reaches its maximum around every 9.5 to 11 years. This cycle was first noted by Heinrich Schwabe in 1843. What defines the length of the Schwabe cycle is one of the most important problems in understanding the solar dynamo mechanism. However, analyzing only the sunspot record of the past 400 years is insufficient for understanding this problem. We need to know about solar activity over a much longer term. Furthermore, the sunspot activity fell to near‐zero levels during a time interval in the late 17th to early 18th century known as the Maunder Minimum. The carbon‐14 content in tree rings is a powerful tool for the study of solar activity before A.D. 1610 and during the Maunder Minimum because 14C is produced in the atmosphere by galactic cosmic rays, and the solar magnetic activity influences the cosmic ray flux on Earth. Due to weather and researcher unavailability, “the” sunspot count is actually an average of observations by multiple people in multiple locations with different equipment, with a scaling factor assigned to each observer to compensate for their differing ability to resolve small sunspots and their subjective division of groups of sunspots. Since 1 July 2015 a revised and updated list of the sunspot numbers has been made available. The biggest difference is an overall increase by a factor of 1.6 to the entire series. Traditionally, a scaling of 0.6 was applied to all sunspot counts after 1893, to compensate for the better equipment of Alfred Wolfer who took over from Rudolf Wolf. This scaling has been dropped from the revised series, making modern counts closer to their raw values. Also, counts were reduced slightly after 1947 to compensate for bias introduced by a new counting method adopted that year, in which sunspots are weighted according to their size. The Sun’s surface, the photosphere, radiates more actively when there are more sunspots. Satellite monitoring of solar luminosity revealed a direct relationship between the Schwabe cycle and luminosity with a peak-to-peak amplitude of about 0.1%. Luminosity decreases by as much as 0.3% on a 10-day timescale when large groups of sunspots rotate across the Earth’s view and increase by as much as 0.05% for up to 6 months due to faculae associated with large sunspot groups. Solar faculae are bright spots that form in the canyons between solar granules which are short-lived convection cells several thousand kilometers across that constantly form and dissipate over timescales of several minutes. Faculae are produced by concentrations of magnetic field lines. Strong concentrations of faculae appear in solar activity, with or without sunspots. The faculae and the sunspots contribute noticeably to variations in the “Solar constant”. The chromospheric counterpart of a facular region is called a plage. Information today comes from SOHO (the Solar and Heliospheric Observatory, a cooperative project of the European Space Agency and NASA), such as the MDI (Michelson Doppler Imager) magnetogram, where the solar “surface” magnetic field can be seen.

MDI Magnetogram 20110111
As each cycle begins, sunspots appear at mid-solar latitudes, and then move closer and closer to the solar equator until a solar minimum is reached. This pattern is best visualized in the form of the so-called butterfly diagram.

The sunspot butterfly diagram constructed and regularly updated by the solar group at NASA Marshall Space Flight Center.

Overview of three solar cycles shows the relationship between the sunspot cycle, galactic cosmic rays, and the state of our near-space environment
Solar maxima and minima also exhibit fluctuations at time scales greater than solar cycles. Increasing and decreasing trends can continue for periods of a century or more. A growing mass of evidence suggests that transient events on the sun affect our weather and long term variations of the sun’s energy output affect our climate. The relationship between solar activity and climate on Earth is built on correlations between changes in solar activity and changes in terrestrial climate. The only continuous solar observations that extend over the climatic time scale of decades to centuries are those of sunspots, yielding a measure of solar magnetic activity. The Cycle seems to be fairly clear in the sunspot record and in its proxy measurements by cosmogenic isotopes. The changes on the Sun cause effects in space, in the atmosphere, and on Earth’s surface. While it is the dominant variable in solar activity, aperiodic fluctuations also occur. They have been observed for centuries as changes in the sun’s appearance and by changes seen on Earth, such as auroras. Associated centennial variations in magnetic fields in the Corona and Heliosphere have been detected using Carbon-14 and beryllium-10 cosmogenic isotopes stored in terrestrial reservoirs such as ice sheets and tree rings and by using historic observations of Geomagnetic storm activity, which bridge the time gap between the end of the usable cosmogenic isotope data and the start of modern satellite data. The level of solar activity beginning in the 1940s is exceptional. The last period of similar magnitude occurred around 9,000 years ago during the warm Boreal period. The Sun was at a similarly high level of magnetic activity for only ~10% of the past 11,400 years. Fossil records suggest that the Solar cycle has been stable for at least the last 700 million years.
Solar activity proxies
Beryllium-10 (10Be) is a radioactive isotope of beryllium formed in the Earth’s atmosphere mainly by cosmic ray spallation of nitrogen and oxygen. Spallation is the process in which a heavy nucleus emits a large number of nucleons as a result of being hit by a high-energy particle, thus greatly reducing its atomic weight. Beryllium-10 has a half-life of 1.39 million years and decays by beta decay to stable boron-10 through the reaction 10Be→10B+e. 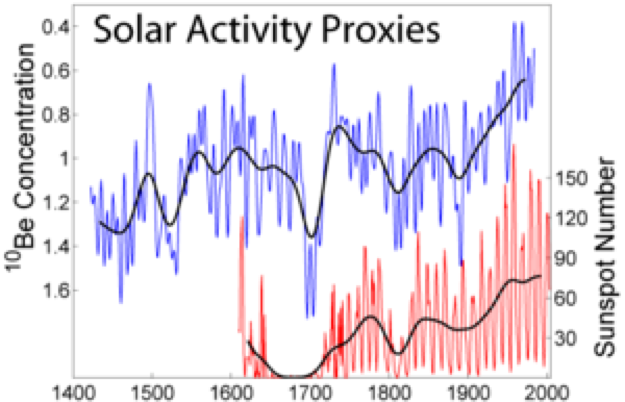 Because beryllium tends to exist in solutions below about pH 5.5 and rainwater above many industrialized areas can have a pH less than 5, it will dissolve and be transported to the Earth’s surface via rainwater. As the precipitation quickly becomes more alkaline, beryllium drops out of solution. Cosmogenic 10Be thereby accumulates at the soil surface, where its relatively long half-life permits a long residence time before decaying to 10B.

14C and 10Be are both produced by nuclear reactions of cosmic ray particles with the atmospheric gases. After production, their fate is very different (system effects). 10Be attaches to aerosols and is transported within a few years to the ground. 14C oxidizes to CO2 and enters the global carbon cycle, exchanging between atmosphere, biosphere, and the oceans.
These variations have been successfully reproduced using models that employ magnetic flux continuity equations and observed sunspot numbers to quantify the emergence of magnetic flux from the top of the solar atmosphere and into the Heliosphere, showing that sunspot observations, geomagnetic activity and cosmogenic isotopes offer a convergent understanding of solar activity variations.
Dendroclimatology
Sunspot numbers over the past 11,400 years have been reconstructed using Carbon-14-based dendroclimatology. Dendroclimatology is the science of determining past climates from trees. Tree rings are wider when conditions favor growth, narrower when times are difficult. Other properties of the annual rings, such as maximum latewood density (MXD) have been shown to be better proxies than simple ring width. By combining multiple tree-ring studies, sometimes with other climate proxy records, scientists have estimated many local climates for hundreds to thousands of years previous. Tree rings are especially useful as climate proxies in that they are clearly demarked in annual increments and respond to multiple climatic effects such as temperature, precipitation, sunlight, and wind. Non-climate factors include soil, tree age, fire, tree-to-tree competition, genetic differences, logging or other human disturbance, herbivore impact, pest outbreaks, disease, and carbon dioxide concentration.
The Milankovitch Cycles and Glaciation
During the last 650,000 years there have been seven cycles of glacial advance and retreat, with the abrupt end of the last ice age about 11,700 years ago marking the beginning of the modern climate era — and of human civilization. Most of these climate changes are attributed to very small variations in Earth’s orbit that change the amount of solar energy our planet receives.
The episodic nature of the Earth’s glacial and interglacial periods within the last couple of million years have been caused primarily by cyclical changes among variations in the Earth’s eccentricity, axial tilt, and precession, collectively known as the Milankovitch Cycles. They were named for Milutin Milankovitch, the Serbian astronomer who is generally credited with calculating their magnitude.
Variations in these three cycles create alterations in the seasonality of solar radiation reaching the Earth’s surface. These times of increased or decreased solar radiation directly influence the Earth’s climate system, particularly the advance and retreat of Earth’s glaciers. The three Milankovitch Cycles impact the seasonality and location of solar energy around the Earth, thus impacting contrasts between the seasons.
The 100,000 year Milankovitch cycle; eccentricity
Variations in the shape of Earth’s elliptical orbit.
The first of the three Milankovitch Cycles is eccentricity, the shape of the Earth’s orbit around the Sun. This constantly fluctuating orbital shape ranges between more and less elliptical (0 to 5% ellipticity) on a cycle of approximately 100,000 years. These oscillations, from more elliptic to less elliptic, are of prime importance to glaciation in that it alters the distance from the Earth to the Sun, thus changing the distance the Sun’s short wave radiation must travel to reach Earth, subsequently reducing or increasing the amount of radiation received at the Earth’s surface in different seasons.
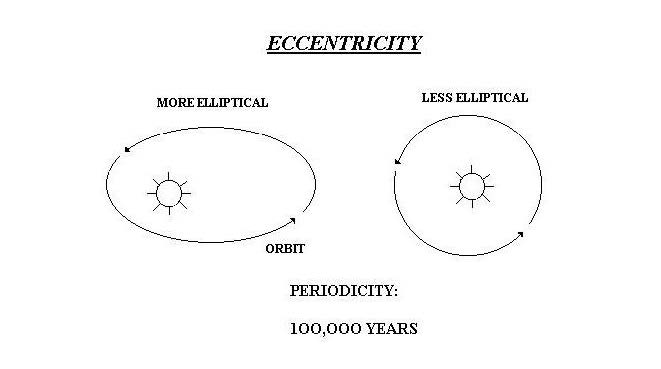
Today a difference of only about 3% occurs between aphelion (farthest point) and perihelion (closest point). This 3% difference in distance means that Earth experiences a 6% increase in received solar energy in January than in July. This 6% range of variability is not always the case, however. When the Earth’s orbit is most elliptical the amount of solar energy received at the perihelion would be in the range of 20% to 30% more than at aphelion. These continually changing amounts of received solar energy around the globe result in significant changes in the climate and glacial regimes of planet Earth. At present the orbital eccentricity is nearly at the minimum of its cycle.
The 41,000 year Milankovitch cycle: axial tilt
The precession of the equinoxes. Earth’s combined tilt and elliptical orbit around the Sun.
Axial tilt, the second of the three Milankovitch Cycles, is the inclination of the Earth’s axis of rotation in relation to the plane of its orbit around the Sun. Oscillations in the degree of the Earth’s axial tilt occur on a periodicity of 41,000 years from 21.5° to 24.5°.

Today the Earth’s axial tilt is about 23.5°, which largely accounts for our seasons. Because of the periodic variations of this angle the differences among the seasons on the Earth changes. With less axial tilt the Sun’s solar radiation is more evenly distributed between winter and summer. However, less tilt also increases the difference in radiation at the surface of the Earth between the equatorial and polar regions.
One hypothesis for Earth’s reaction to a smaller degree of axial tilt is that it would promote the growth of ice sheets. This response would be due to a warmer winter, in which warmer air would be able to hold more moisture, and subsequently produce a greater amount of snowfall. In addition, summer temperatures would be cooler, resulting in less melting of the winter’s accumulation. At present, axial tilt is in the middle of its range.
The 23,000 year Milankovitch cycle: precession
Cycle of the +/- 1.5° wobble in Earth’s orbit (tilt)
The third and final of the Milankovitch Cycles is precession, a slow wobble as the Earth turns on its axis. A consequence of the precession is a changing pole star.

The precession of Earth changes the orientation of the Earth and moves the “north” star over time to a different constellation in the night sky. The current pole star is Polaris located about one degree from the pole. The brilliant Vega in the constellation Lyra was the pole star around 12,000 BC and will be the pole star again around the year 14,000, however, it never comes closer than 5° to the true pole.
This top-like wobble, or precession, has a periodicity of 23,000 years.

When the axis of the Earth is tilted towards Vega the positions of the Northern Hemisphere winter and summer solstices will coincide with the aphelion and perihelion, respectively of the elliptical orbit. This means that the Northern Hemisphere will experience winter when the Earth is furthest from the Sun and summer when the Earth is closest to the Sun. This coincidence will result in greater seasonal contrasts. At present, the Earth is at perihelion very close to the winter solstice.
These variables are important because the Earth has an asymmetric distribution of landmasses, with virtually all, except Antarctica, located in the Northern Hemisphere.
At times when Northern Hemisphere summers are coolest—farthest from the Sun due to precession and greatest orbital eccentricity—and winters are warmest due to minimum tilt of the axis, snow can accumulate and cover broad areas of northern America and Europe. At present, only precession is in the glacial mode, with tilt and eccentricity not favorable to glaciation
Even when all of the orbital parameters favor glaciation, the increase in winter snowfall and decrease in summer melt would be barely enough to trigger glaciation, not to grow large ice sheets. Ice sheet growth requires the support of positive feedback loops, the most obvious of which is that large masses of ice and snow tend to reflect more radiation back into space thus cooling the climate and allowing glaciers to expand.
The Energy Budget of the Earth

The oceans of the Earth are vast, and owing to the specific heat of water, they contain vast amounts of thermal energy. Much of that energy is transferred around the earth through ocean currents. Some is transmitted to and from the atmosphere and controls local weather.
Ocean currents are driven by wind, the Coriolis effect, and thermohaline circulation which depends on density differences of waters entering the ocean.
The Winds
Wind is the primary force driving surface currents in the ocean. The sun heats the surface of the earth unevenly because of the shape and tilt of the earth. Warm air masses form where the sun’s radiation is most intense, at the equator. Cold air masses form at the poles, where the sun’s radiation is less intense. Warmer air masses rise into the atmosphere, creating areas of low pressure. As air masses cool high in the atmosphere, then sink and create areas of high pressure. The rising and sinking of air masses in the earth’s atmosphere create winds.
Rising warm, moist air at the equator travels northward and southward, cooling as it moves towards the poles. When this air reaches a certain cold temperature and density (at about 30 degrees N and S latitude), it sinks and creates an area of high pressure.
Where the air sinks, some travels towards the pole and some travels towards the equator. This air motion creates strong winds flowing from the west (“westerlies” and the northeast (trade winds) in the Northern Hemisphere. These dominant wind patterns drive oceanic currents.

Global winds
The Coriolis force and effect
Because the the earth rotates, rising air at the equator and sinking air at higher latitudes along a curved path relative to the surface of the earth as it flows creating winds in westerly and northeasterly directions because the earth is rotating beneath the air. This is known as the Coriolis effect.
Because of the direction of earth’s rotation, the Coriolis effect deflects air to the east as it flows towards the poles and towards the west as it flows towards the equator in the northern hemisphere. These deflected winds are known as “westerlies” and “northeasterly trade winds.”

coriolis effect on winds in Northern and Southern hemispheres
The Coriolis effect and ocean currents
Water set in motion by the wind is also deflected to the right in the Northern hemisphere and the left in the Southern hemisphere. At the surface in the Northern Hemisphere, water is transported at a net angle of 90 degrees to the right of the prevailing wind direction. This phenomenon is known as Ekman Transport, and is an important concept for understanding coastal upwelling and downwelling.
The motion of the winds and deflection of water towards the right (northern hemisphere) and left (southern hemisphere) of the prevailing wind directions generates large circular current systems in the world’s oceans known as gyres.
Deflection of water towards the center of the gyre due to the Coriolis effect causes water to “pile up” in the center of the gyre, creating an area of slightly higher elevation on the surface of the ocean. Gravity then pulls the water back down the slope to an area of lower elevation, fueling further rotation of the gyre.
Currents along the western side of gyres are called western boundary currents, while currents along the eastern side of gyres are called eastern boundary currents. The westerly flowing currents that are created where the North Pacific and South Pacific gyres meet are known as the equatorial currents
Western boundary currents flow deeper and stronger than eastern boundary currents. This means that cool, nutrient-rich water is closer to the surface in eastern boundary currents than western boundary currents. This results in the creation of rich upwelling zones in areas with eastern boundary currents, such as the California Current.

The major ocean gyres
Another consequence of the Earth’s eastward rotation and the resulting Coriolis effect is that the center of each of those gyres is offset toward the western edge of the ocean basin that confines it. Because the volume of water flowing toward the poles along the narrower western sides of the gyres is the same as that circulating back toward the Equator down the much broader eastern expanses, the constricted western currents are forced to flow much faster than their eastern counterparts. This results in such powerful currents as the Gulf Stream in the western North Atlantic, and the Kuroshio in the North Pacific.
The Gulf Stream starts roughly where the Gulf of Mexico narrows to form a channel between Cuba and the Florida Keys. From there the current flows northeast through the Straits of Florida between the mainland and the Bahamas, flowing at a substantial speed for some 400 miles.

The satellite photo shows the Gulf Stream, with the red being the warmest water and blue being the coolest.
While wind can play a role in shaping surface ocean currents, it is not the main or only factor. Wind plays virtually no role at all when it comes to deep ocean currents. The main drivers of ocean currents are the Coriolis force, density differences, tides and shoreline obstruction.
The Coriolis force is very weak, but when a lot of water is involved, such as in the ocean, the Coriolis force plays a large role. Because of the Coriolis force, the major ocean currents in the northern hemisphere tend to spiral clockwise and they tend to spiral counter-clockwise in the southern hemisphere.

Ocean current patterns. NOAA.
The Coriolis force is an inertial force that arises from the earth being in a rotating reference frame. It is very real in the rotating reference frame, but is not fundamental as it arises from the motion of the frame itself.
The Sargasso Sea

The Sargasso Sea is a region of the North Atlantic Ocean bounded by four currents forming an ocean gyre. Unlike all other regions called seas, it has no land boundaries. The Sargasso Sea is bounded on the west by the Gulf Stream, on the north by the North Atlantic Current, on the east by the Canary Current, and on the south by the North Atlantic Equatorial Current, all of which establish a clockwise-circulating system of ocean currents termed the North Atlantic Gyre. It lies between 70°and 40° W, and 20°to 35° N, and is approximately 1,100 km wide by 3,200 km long. Bermuda is near the western fringes of the Sargasso Sea.

It is distinguished from other parts of the Atlantic Ocean by its characteristic brown Sargassum seaweed and often calm blue water.
Geostrophic balance
Atmospheric winds and oceanic currents are driven by pressure gradients, from high towards low pressure. If the flow is maintained for a significant fraction of a day (i.e. several hours), then the Coriolis force, which acts on the moving fluids, air and water, will cause it to veer to the right of the pressure gradient in the northern hemisphere and to the left of the pressure gradient in the southern hemisphere. Given sufficient time, the flow will end up traveling at near right-angles to the pressure gradient, at which point, the Coriolis and the pressure gradient forces may be equal and opposite and the flow is said to be in “geostrophic balance”, and will persist in a rotational (cyclonic) pattern, counter-clockwise around a low pressure region in the northern hemisphere and clockwise in the southern. Around a high pressure zone the circulation is anti-cyclonic; clockwise in the northern hemisphere and counter-clockwise in the southern. It is geostrophic flows which cause storms and hurricanes to spin, and is the dynamics behind the “red spot” storm on the planet Jupiter.

The Coriolis Effect on storm cloud patterns. NASA.

Thermohaline circulation (THC
(THC) is a part of the large-scale ocean circulation that is driven by global density gradients created by surface heat and freshwater fluxes.The word thermohaline derives from thermo, referring to temperature, and haline, referring to salt content, factors which together determine the density of sea water.
Wind-driven surface currents such as the Gulf Stream travel polewards from the equatorial Atlantic Ocean, cooling en route and eventually sinking at high latitudes forming North Atlantic Deep Water. This colder denser water sinks and flows into the ocean basins. While the bulk of it upwells in the Southern Ocean, the oldest waters with a transit time of around 1000 years eventually upwell in the North Pacific establishing that the oceans of the Earth are a global system. On their journey, the water masses of the THC transport both energy in the form of heat and matter as solids, dissolved substances, and gases around the globe.

Thermohaline Circulation “Conveyor Belt” South polar view
The thermohaline circulation is sometimes called the ocean conveyor belt, the great ocean conveyor, or the global conveyor belt.

MAOC_2021_Nature
The Atlantic Meridional Overturning Circulation (AMOC) is is a sensitive nonlinear system dependent on subtle thermohaline density differences in the ocean. There is evidence that the AMOC is slowing down and that the AMOC is presently in its weakest state in over 1,000 years. The AMOC is a a major mechanism for heat redistribution on Earth and an important factor in climate variability and change.
As continuous direct measurements of the AMOC started only in 20044 longer-term reconstruction must be based on proxy data: (1) reconstructions of surface or subsurface temperature patterns in the Atlantic Ocean that reflect the changes in ocean heat transport associated with the AMOC; (2) reconstructions of subsurface water mass properties, for example, the advance of the subpolar versus subtropical slope water, that reflect AMOC changes; and (3) evidence for physical changes in deep-sea currents, such as those reflected by changes in sediment grain size. All three proxies can be influenced to some degree by factors in addition to changes in the AMOC.
Despite the different locations, timescales and processes represented by these proxies, they provide a consistent picture of the AMOC evolution since about AD 400. Before the nineteenth century, the AMOC was relatively stable. A decline in the AMOC, beginning during the nineteenth century occurred during the Little Ice Age of the 1790s. Around 1960 there began a phase of particularly rapid decline that is found in several, largely independent proxies followed by a short-lived recovery in the 1990s before a return to decline from the middle of the first decade of the 2000s. All indices additionally show multi-decadal variability consistent with the evidence that climate changes continuously and always had with only relatively limited periods of stability.
Temperature-density effects
Fresh waters are lighter than saline waters and warm waters are lighter than cold waters. The density of a water mass will determine whether it rises or sinks in the water column. Density differences create currents in the oceans.
Fluctuations in both temperature and salinity lead different regions of ocean water to have different densities. Higher temperatures, such as near the equator, cause a mass of water to expand and therefore drop in density. Also, lower salt content causes a mass of water to be lower in density. Gravity causes the more dense water to fall, pushing away the less dense water, which moves laterally and rises. Giant convection loops of ocean currents form as the lighter, warmer, and less salty regions of the oceans rise and flow to replace the heavier, cooler, and more salty regions of the oceans. The effect of density-driven currents is fundamentally a result of the interplay among solar heating, gravity, and salinity differences.
One possible effect of such changes in density is that warm events after glacial events deliver low-salinity, thus low-density, melt waters into the ocean which tend to float rather than sink in areas where sinking (downwelling) normally takes place. This action interferes with total normal oceanic circulation; e.g. the Gulf Stream may be diverted eastward by melt waters from the North American arctic, depriving England and northern Europe of the heat now moderating their climate.
If massive events such as floods of fresh water backed up in proglacial lakes were to spill into the ocean, then very rapid climate changes could take place by changing the ocean circulation patterns. At least two such events took place near the beginning of the present interglacial stage, with up to 4°–5° C rapid temperature swings in the Sargasso Sea.

The Carbon Cycle
 The carbon cycle is one of the biogeochemical cycles of the Earth that is most critical to the existence of life on the planet.
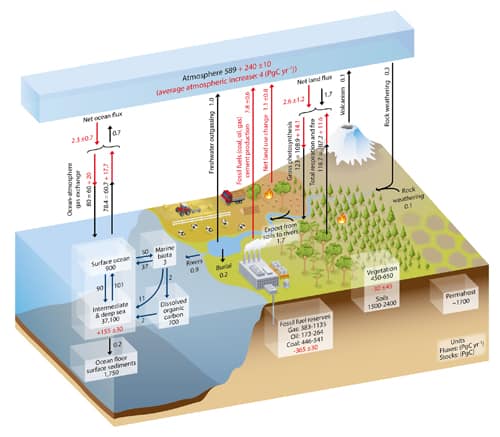
Fossil-fuel emissions, agricultural fertilization of croplands, and organic sewage discharges to aquatic systems have become part of and disturbed the carbon cycle. Land-use changes affect the uptake or release of carbon. Deforestation may result in weakening of the terrestrial carbon sink in the future. A change in the intensity of the thermohaline circulation could increase the ability of coastal marine waters to store atmospheric CO2.

Methods of estimating ancient temperatures
The geologic record contains many clues about former climates on Earth. Most of the proxies used to interpret past temperatures agree well enough to build a consensus about the more recent geologic past, and general acceptance of large-scale changes in the more distant past.
The geologic record of temperature variations/anomalies over the last two thousand years is rather well detailed.

There is still considerable detail back to the end of the last “Ice Age,” approximately 10,000 years ago.


Ice-core materials from mid- to low-latitude glaciers represent a time span of approximately 25,000 years and provide valuable insight into regional variation in climate patterns. Oxygen isotopes are used as a proxy for actual temperature.

The Greenland and Antarctic ice sheets today

Antarctic ice core stations

Climates throughout the Pleistocene geological epoch, often referred to colloquially as the Ice Age, which lasted from about 2,588,000 to 11,700 years ago are well documented; but the geologic records become progressively destroyed by erosion and tectonic cycling as time passes.
The accuracy of interpretations of past climates declines as we go farther back into the past.
Climates of 600 million years ago are less well documented, and those of billions of years ago are poorly documented.
Reconstructing paleoclimate
Reconstruction of paleoclimatic conditions based on the study of stable isotopes in ice core materials is one such proxy which is robust and not subject to uncertainties related to erosion, tectonism, or sedimentation processes. It has evolved into a well-recognized and powerful methodology.


O2 isotopes as paleoclimate proxies
Oxygen has three naturally occurring isotopes: 16O, 17O, and 18O, where the superscripts 16, 17 and 18 refer to the atomic mass. The most abundant oxygen isotope on Earth is 16O, with a small percentage of 18O and an even smaller percentage of 17O.
Oxygen isotope analysis determines the ratio of 18O to 16O present in a sample; then compares the calculated ratio of those masses to a standard to obtain information about the temperature at which the sample ice was formed.

Oxygen isotope ratio analysis
Oxygen isotopes, temperature, and weather
Because 18O is two neutrons “heavier” (more massive) than 16O and causes the water molecule in which it occurs to be heavier by that amount, it requires more energy to vaporize H18OH than H16OH (the water molecule is often written by organic chemists as HOH rather than H2O), and H18OH liberates more energy when it condenses. In addition, H16OH tends to diffuse more rapidly.
Because H16OH requires less energy to vaporize, and is more likely to diffuse to the liquid surface, the first water vapor formed during evaporation of liquid water is enriched in H16OH, and the residual liquid becomes enriched in H18OH.
When water vapor condenses into liquid, the “heavier” H18OH preferentially enters the liquid, while H16OH is concentrated in the remaining vapor.
As an air mass moves from a warm region to a cold region, water vapor condenses and is removed as precipitation. The precipitation removes H18OH, leaving progressively more H16OH-rich water vapor. This distillation process causes precipitation to have a lower ratio of 18O/16O as the temperature decreases. Additional factors can affect the efficiency of the distillation, such as the direct precipitation of ice crystals, rather than liquid water, at low temperatures.
Temperature and isotope ratios
Due to the intense precipitation that occurs in hurricanes, the H18OH is exhausted relative to the H16OH resulting in relatively low 18O/16O ratios. The subsequent uptake of hurricane rainfall in trees creates a record of the passing of hurricanes that can be used to create a historical record in the absence of human records.
When water evaporates in a time of cold temperatures relatively few atoms of the heavier 18O are picked up as compared to 16O, whereas in warm temperatures with more energy, more 18O is picked up. When that water is dropped on glaciers and preserved as ice, that ratio of isotopes is preserved. That permits the calculation of temperature from measuring the relative abundance of each isotope in ice core samples.
In geochemistry, paleoclimatology and paleoceanography δ18O is a measure of the ratio of stable isotopes oxygen-18 (18O) and oxygen-16 (16O). It is commonly used as a measure of the temperature of precipitation, as a measure of groundwater/mineral interactions, and as an indicator of processes that show isotopic fractionation, like methanogenesis. In paleosciences, 18O:16O data from corals, foraminifera and ice cores are used as a proxy for temperature.
Paleoclimate from benthic organisms
Using measurements of δ18O in benthic foraminifera from 57 globally distributed deep sea sediment cores taken as a proxy for the total global mass of glacial ice sheets, Lorraine Lisiecki was able to reconstruct the climate for the past five million years.

Lisiecki, L. E., and M. E. Raymo (2005), A Pliocene-Pleistocene stack of 57 globally distributed benthic δ18O records, Paleoceanography, 20, PA1003, doi:10.1029/2004PA001071.
The stacked record of the 57 cores was orbitally tuned to an orbitally driven ice model, the Milankovitch cycles of 41 ky (obliquity), 26 ky (precession) and 100 ky (eccentricity), which are all assumed to cause orbital forcing of global ice volume. Over the past million years, there have been a number of very strong glacial maxima and minima, spaced by roughly 100 ky.

Glacial Cycles and benthic foraminifera
Paleoclimate from insects
In addition to techniques that may reveal paleoclimate information from marine settings, some lines of evidence are based exclusively on terrestrial organisms. Insects, specifically fossil beetles, provide such evidence.
A fossil beetle assemblage collected from northern Greenland demonstrates an unusual level of stasis through approximately 2 million years, even though the climate at that time was significantly warmer than that of today. The number of species remained relatively constant through several episodes of glaciation.
Beetles are highly mobile insects, and their most apparent response to variation in climate is migration from one location to another. This is well illustrated by the replacement (21,500 b.p.) of a forest fauna along the North American Laurentide ice sheet by a glacial fauna when temperatures were approximately 10°–12° C below current ones. When the ice sheet receded (approximately 12,500 b.p.), a forest fauna returned. Overall, beetles have survived global climatic changes due to their mobility.
Paleoclimate from stomatal index records
SI (Stomatal Index) values for birch trees dated (by radiocarbon) at 10,070 years correspond to CO2 levels of approximately 240 to 280 parts per million, volume (ppmv). Birch trees that are 9370 years old have SI values indicating CO2 concentrations of 330–360 ppmv. Thus, these findings indicate an 80–90 ppmv variation in naturally occurring CO2 levels over a 700-year period. Additionally, SI data suggest a dramatic change of 65 ppmv CO2 levels in less than a century.
Several lines of evidence indicate that early to middle Miocene time, 23.03 to 5.333 million years ago, was one of the warmest periods of the entire Cenozoic, 66 to 0 million years ago. Fossil angiosperm materials of middle Eocene age showed elevated SI values indicating 450–500 ppmv for the CO2 level of the middle Eocene atmosphere.
Sea level changes
Sea surface level changes are measured today by specially purposed satellites.

The sea-level record approximates the “sawtooth” effect seen in the temperature records, that is, sharp warming episodes that gradually cool. The causes of this sawtooth effect are still being debated, but for glacial and interglacial episodes it may be the result of polar ocean freezing and cutting off moisture to feed continental glaciers, with rapid warming and sea-level rise as a consequence, or thermohaline circulation changes.
Over most of geologic history, long-term average sea level has been significantly higher than today. In the first graphic time moves from the Cambrian ~542 Ma ago on the left to the relatively recent Neogene ending ~2.58 Ma ago. Ma means “million years according to ISO rules.

Sea Level change through time
In this second graph covering the same period, the Cambrian is on the right and the Neogene is on the left. Otherwise the figures are equivalent.

Comparison of two sea level reconstructions during the last 500 Ma. The scale of change during the last glacial/interglacial transition is indicated with a black bar.
Various factors affect the volume or mass of the ocean and lead to long-term changes in eustatic sea level, the worldwide change of sea level elevation with time. The two primary influences are temperature because the density of water depends on its temperature, and the mass of water locked up on land and sea as fresh water in rivers, lakes, glaciers and polar ice caps.
Modern era sea level changes
Data published by NOAA (National Oceanic & Atmospheric Administration) from the Battery at the tip of Manhattan Island. since the Civil War era. It is one of the longest continuous records we have of sea level rise. The rate of increase is about 10 inches per hundred years and shows no acceleration whatsoever despite substantial increases in CO2 during that time.
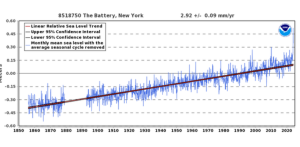
NYC Battery sea level change
Ocean basin changes
Over long geological timescales, changes in the shape of oceanic basins and in land–sea distribution affect sea level. The shape of the ocean basins can change due to tectonic movement. If an ocean basin becomes larger, overall sea level will fall because there is no increase in the volume of ocean water. If the ocean basins become smaller, sea level rises accordingly. Orogeny (mountain building) and isostatic uplift are tectonic processes that change the sea level of an affected ocean basin

Orogeny affects the volume of ocean basins

Isostatic uplift affects the volume of ocean basins
Eustatic sea level changes
Eustatic change occurs when the sea levels changes due to an alteration in the volume of water in the oceans or, alternatively, a change in the shape of an ocean basin and hence a change in the amount of water the sea can hold. Eustatic change is always a global effect.
During and after an ice age, eustatic change takes place. At the beginning of an ice age, the temperature falls and water is frozen and stored in glaciers inland, suspending the hydrological cycle. Water is taken out of the sea but not being replaced leading to an overall fall in sea level.
As an ice age ends, the temperature begins to rise and so the water stored in the glaciers reenters the hydrological cycle, the sea is replenished, and sea levels rise.
Evidence demonstrates that the last interglacial between approximately 135,000 and 115,000 years ago, maximum sea-level rise was about 6 meters (m) above the present sea level.
Since the Last Glacial Maximum about 20,000 years ago, sea level has risen by more than 125 m, with rates varying from tenths of a mm/yr to 10+mm/year.

During deglaciation between about 19,000 and 8,000 calendar years ago, sea level rose at extremely high rates as the result of the rapid melting of the British-Irish Sea, Fennoscandian, Laurentide, Barents-Kara, Patagonian, Innuitian ice sheets and parts of the Antarctic ice sheet. At the onset of deglaciation about 19,000 calendar years ago, a brief, at most 500-year long, glacio-eustatic event may have contributed as much as 10 m to sea level with an average rate of about 20 mm/yr. During the rest of the early Holocene, the rate of sea level rise varied from a low of about 6.0–9.9 mm/yr to as high as 30–60 mm/yr during brief periods of accelerated sea level rise.
Solid geological evidence, based largely upon analysis of deep cores of coral reefs, exists only for 3 major periods of accelerated sea level rise, called meltwater pulses, during the last deglaciation. They are Meltwater pulse 1A between circa 14,600 and 14,300 calendar years ago; Meltwater pulse 1B between circa 11,400 and 11,100 calendar years ago; and Meltwater pulse 1C between 8,200 and 7,600 calendar years ago. Meltwater pulse 1A was a 13.5 m rise over about 290 years centered at 14,200 calendar years ago and Meltwater pulse 1B was a 7.5 m rise over about 160 years centered at 11,000 years calendar years ago.
In sharp contrast, the period between 14,300 and 11,100 calendar years ago, which includes the Younger Dryas interval, was an interval of reduced sea level rise at about 6.0–9.9 mm/yr. Meltwater pulse 1C was centered at 8,000 calendar years and produced a rise of 6.5 m in less than 140 years. Such rapid rates of sea level rising during meltwater events clearly implicate major ice-loss events related to ice sheet collapse. The primary source may have been meltwater from the Antarctic ice sheet.

Other studies suggest a Northern Hemisphere source for the meltwater in the Laurentide ice sheet.

The Laurentide Ice Sheet was a massive sheet of ice that covered millions of square kilometers, including most of Canada and a large portion of the northern United States, multiple times during the Quaternary glacial epochs— from 2.588 ± 0.005 million years ago to the present.
The last advance covered most of northern North America between c. 95,000 and c. 20,000 years before the present day, and among other geomorphological effects, gouged out the five Great Lakes and the hosts of smaller lakes of the Canadian shield. These lakes extend from the eastern Northwest Territories, through most of northern Canada, and the upper Midwestern United States (Minnesota, Wisconsin, and Michigan) to the Finger Lakes, through Lake Champlain and Lake George areas of New York, across the northern Appalachians into and through all of New England and Nova Scotia.
At times, the ice sheet’s southern margin included the present-day sites of northeastern coastal towns and cities such as Portsmouth, New Hampshire, Boston, and New York City, and Great Lakes coastal cities and towns as far south as Chicago and St. Louis, Missouri, and then followed quite precisely the present course of the Missouri River up to the northern slopes of the Cypress Hills, beyond which it merged with the Cordilleran Ice Sheet. The ice coverage extended approximately as far south as 38 degrees latitude in the mid-continent.

Recently, it has become widely accepted that late Holocene, 3,000 calendar years ago to present, sea level was nearly stable prior to an acceleration in the rate of rise that is variously dated between 1850 and 1900 AD. Late Holocene rates of sea level rise have been estimated using evidence from archaeological sites and late Holocene tidal marsh sediments, combined with tide gauge and satellite records and geophysical modeling. This research included studies of Roman wells in Caesarea and of Roman piscinae (fish ponds) in Italy. These methods in combination suggest a mean eustatic component of 0.07 mm/yr for the last 2000 years.
Since 1880, however, the ocean has begun to rise briskly: a total of 210 mm (8.3 in) through 2009 causing extensive erosion worldwide.
The origins of the CO2 Controversy
In 1896, Svante Arrhenius, started the debate on the effect of atmospheric carbon dioxide concentration on global temperature with his original work on atmospheric gases, On the Influence of Carbonic Acid upon the Temperature of the Ground in which he stated that “if the quantity of carbonic acid [carbon dioxide] increases in geometric progression, the augmentation of the temperature will increase nearly in arithmetic progression.” Arrhenius, who first identified carbon dioxide as a “greenhouse gas” in 1896, in the same paper also showed that carbon dioxide loses effectiveness logarithmically with increasing concentration so that the greenhouse effect attributable to the rise from 100 to 200 parts per million (ppm) is much greater than during the rise from 300 to 400 ppm. A part per million has been likened to a jigger of vermouth in a railroad car full of gin—the recipe for a very very dry martini.
Permission to Repost. You may reproduce this article in its entirety on social media, blogs, and other websites without requesting additional permission, provided the article is reproduced in full without alteration, identifies Victor John Yannacone, Jr. as the author, and includes a prominent link to the original article on this website.